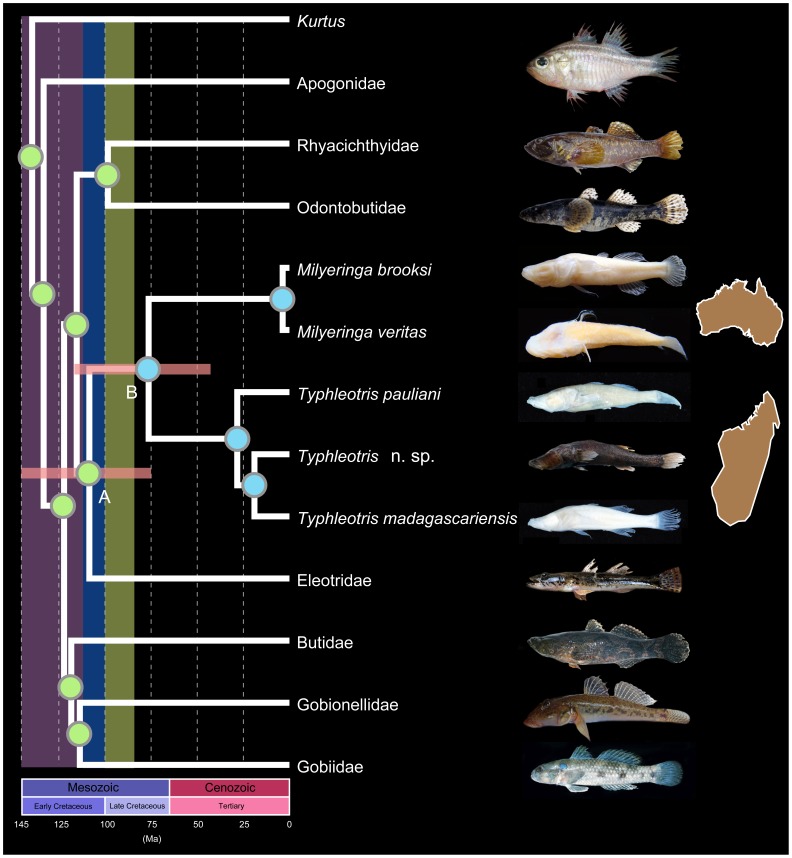
Figure 1. Evolutionary relationships and divergence times of Gobiiformes.
Red horizontal bars represent 95% interval of potential estimated divergence times for that clade. Vertical bars represent hypothesised timing of key geologic events based on geophysical data [27]–[29], [33]–[34] including: intact Eastern Gondwana landmass (Antarctica, Australia, Indo-Madagascar) in purple; separation of Indo-Madagascar from Antarctic landmass in blue; and separation of Madagascar from India in green. Circles indicate likelihood-based ancestral character reconstructions for presence of functional eyes (green), or the lack of functional eyes, i.e., blindness (blue).

