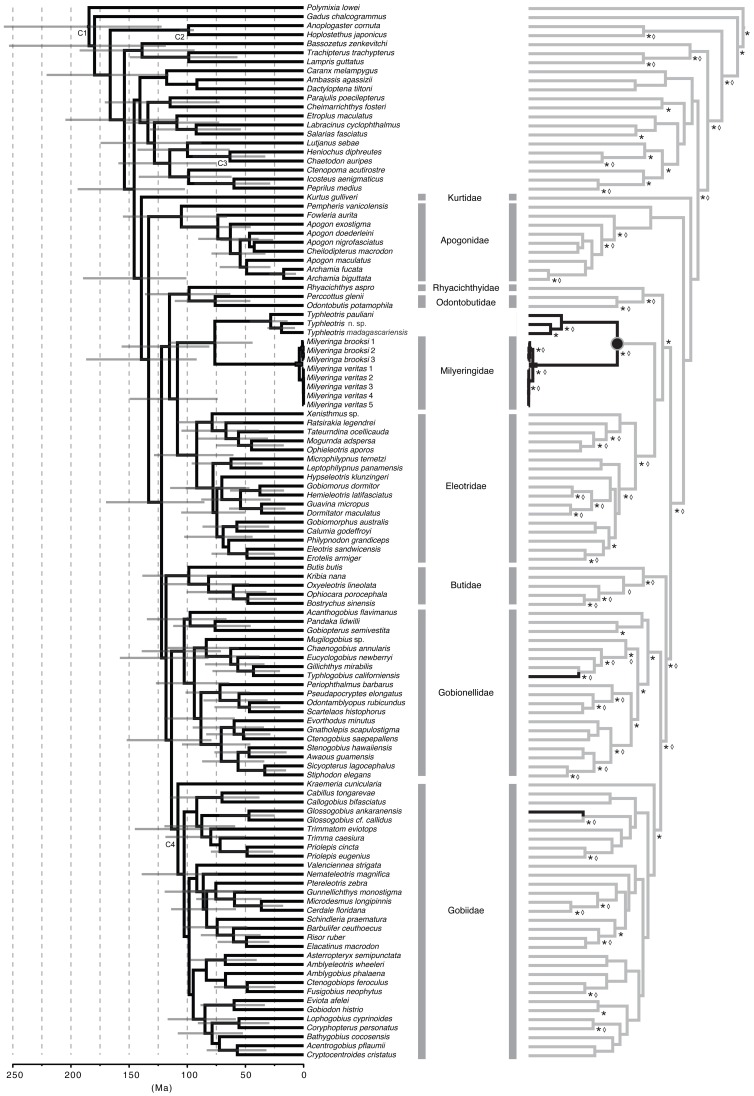
Figure 2. Evolutionary relationships and estimated divergence times for members of the order Gobiiformes.
Grey horizontal bars represent 95% interval of potential divergence times. Phylogeny on right indicates likelihood-based ancestral character reconstructions for presence of functional eyes (grey lines), and functionally blind (black lines). An *indicates posterior probability support for node in the Bayesian analysis of greater than 95%, whereas a diamond indicates a bootstrap greater than 60% for the likelihood reconstruction.

