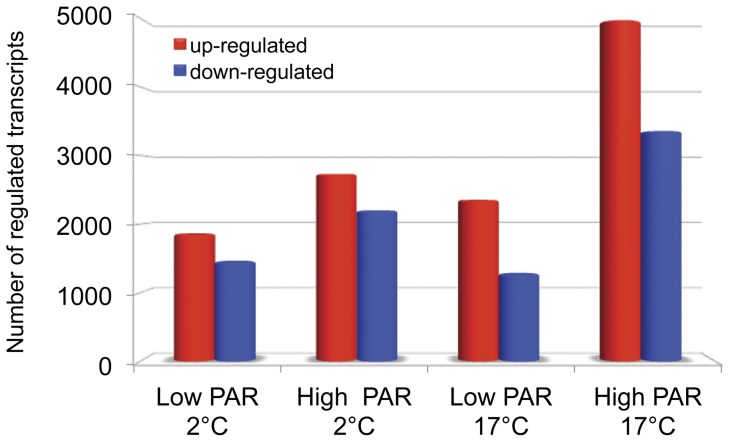
Figure 2. Numbers of differentially up- (red bars) and down-regulated (blue bars) genes after various stress treatments.
The figure displays the numbers of up- and down regulated genes in S. latissima after 24 h of exposure to different temperatures (2°C/17°C) and different light conditions (low/high PAR). Identification of regulated ESTs is based on microarray hybridizations and evaluated with an ANOVA against a control treatment with n = 4 and p<0.01, followed by a post hoc Tukey test (HSD, p<0.01).

