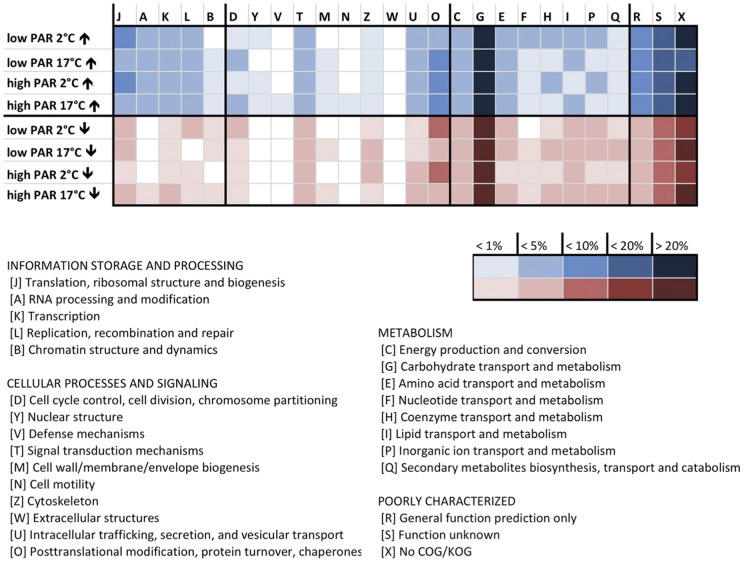
Figure 4. KOG category distributions of differentially expressed transcripts determined by microarray hybridizations.
The figure displays the KOG category distribution of up (↑) and down (↓) regulated transcripts in S. latissima after exposure to the stress treatments in comparison to the control treatment. Color intensities reflect the amount of ESTs per group calculated in percent of total ESTs grouped into KOGs with known or general function prediction.

