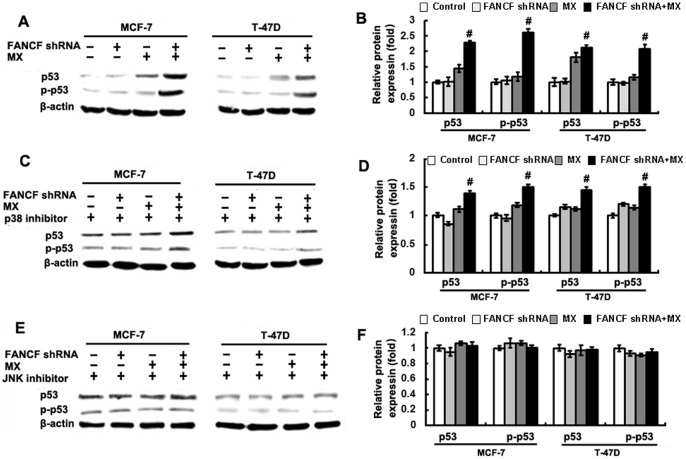
Figure 5. Up-regulation of p53 by FANCF shRNA and MX in breast cancer cells.
(A) Total cellular proteins (50 μg) from exponentially growing cells treated as indicated in the figure were subjected to western blot analysis with antibodies directed against p53 or p-p53 form as indicated. β-actin was applied as control for equal loading. Cells were pre-treated with p38 inhibitor SB203580 (C) or JNK inhibitor SP600125 (E) for 2 h, and then treated as indicated in the figure were subjected to western blot analysis. (B), (D) and (F) The quantitative analysis of the fold increase of p53 expression in MCF-7 and T-47D cells compared with the controls. P values, # P<0.05 versus transfected with FANCF shRNA and MX in cells. P values, # P<0.05.

