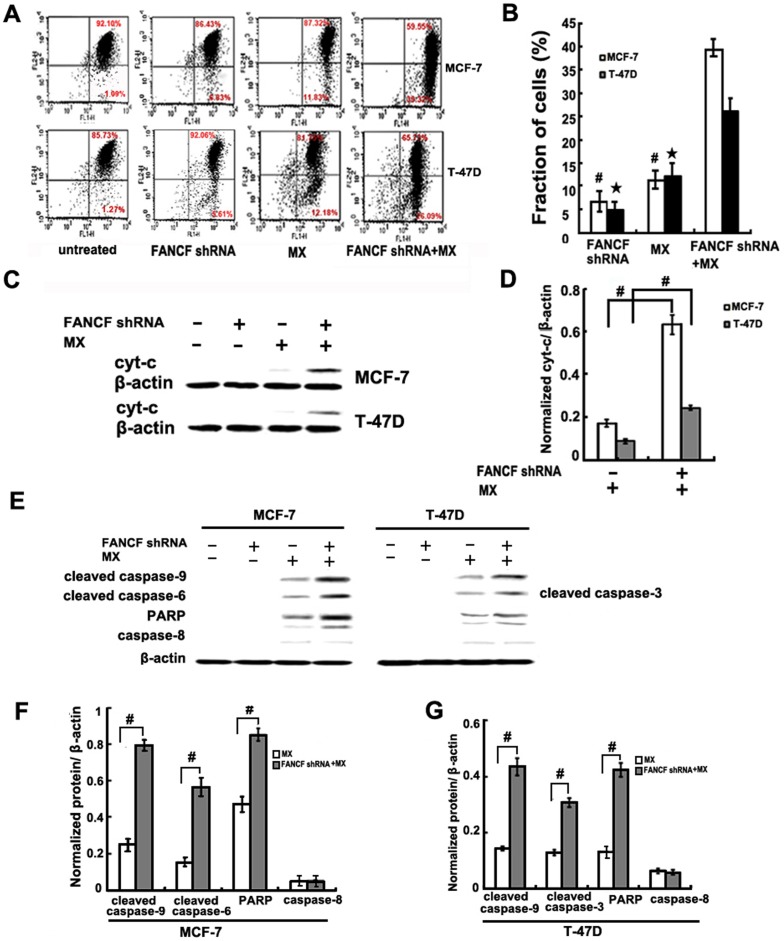
Figure 6. FANCF gene silencing induced the mitochondrial apoptosis pathway in MCF-7 and T-47D cells.
(A) The cells were stained with JC-1 fluorescence dye, and the change in ΔΨm was examined by FACS. (B) Densitometric analysis was done for fraction of cells. P values, # P<0.05 versus transfected with FANCF shRNA and MX in MCF-7 cells.★P<0.05 versus transfected with FANCF shRNA and MX in T-47D cells, (C) Cytosolic lysates were prepared and subjected to SDS-PAGE followed by Western blotting with cyt-c antibody. (D) Densitometric analysis was done for cyt-c expression. P values, # P<0.05. (E) Whole lysates from cells treated as indicated in the figure were subjected to western blot analysis with the indicated antibodies recognizing cleaved products of caspase 9, caspase 3, caspase 6 and PARP. (F) Densitometric analysis was done for proteins expression. P values, # P<0.05.

