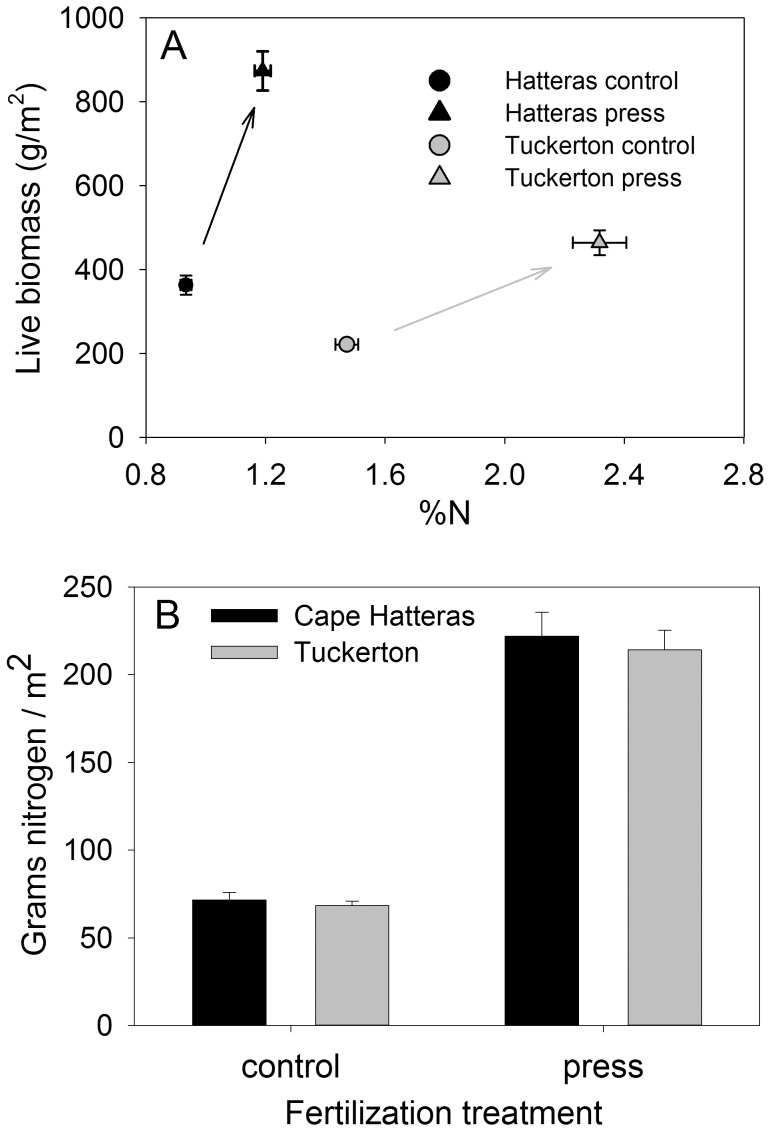
Figure 3. Similarities and differences in the Spartina response to fertilization at CHNS and TUCK (means ±se).
Responses of Spartina live biomass and %N to press fertilization differed significantly between the two marshes when averaged over the duration of the study (A). Arrows indicate the change caused by fertilization at each marsh. In contrast, fertilization increased nitrogen density (gN/m2 in live Spartina) by the same amount at the two marshes when averaged over the duration of the study (B).

