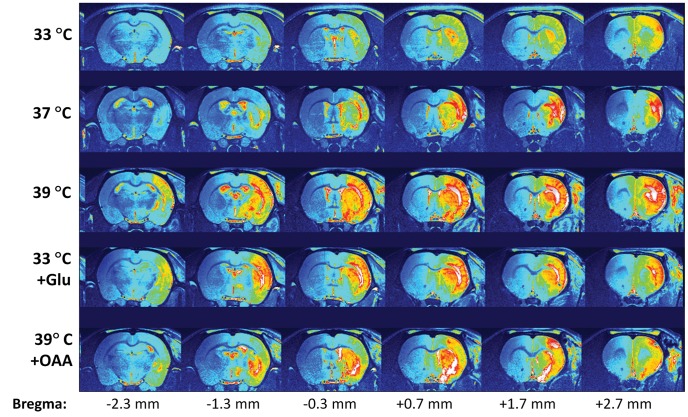
Figure 3. Pseudocolor T2 weighted MR images of a representative brain of each group.
Images include 7 consecutive 1-mm thick coronal slices, showing the extent of the ischemic damage throughout the whole brain (position of each slice compared to Bregma, to Paxinos and Watson [45], is presented at the bottom).

