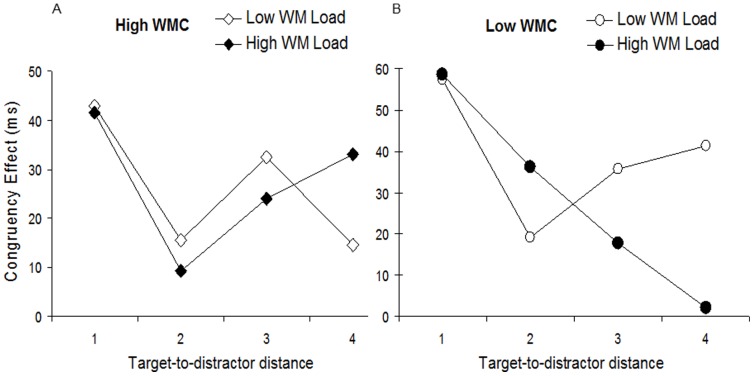
Figure 4.
Experiment 2 RT congruency effects graph. Mean congruency as a function of target-to-distractor distance in A) High and B) Low WMC groups under High and Low WML. Note that the typical Mexican-hat profile is evident in High WMC under Low Load, with a relatively strong congruency effect at distance d1 (first attention zone, a1), followed by weaker congruency at distance d2 (first suppression zone, s1), stronger congruency at distance d3 (second attention zone, a2), and finally weaker congruency at distance d4 (peripheral suppression or unattended zone, s2).

