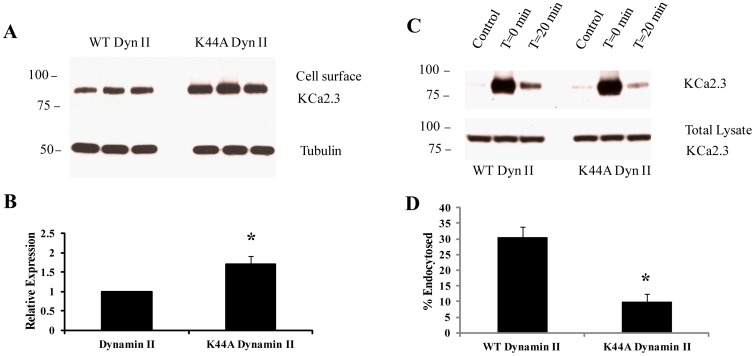
Figure 4. DN dynamin II (K44A) slows down endocytosis of KCa2.3.
A. BLAP-KCa2.3 was co-expressed with either WT or K44A dynamin II and cell surface expression of the channel evaluated in triplicate as detailed in the Methods (top panel). Tubulin was used as a loading control (bottom panel). The data were quantified by densitometry for three separate experiments and plotted as shown in B. Expression of K44A dynamin II resulted in a significant increase in cell surface KCa2.3 expression (*p<0.05). C. BLAP-KCa2.3 was co-expressed with either WT or K44A dynamin II and endocytosis of the channel assessed. Plasma membrane proteins were biotinylated using EZ-Link Sulfo-NHS-SS-Biotin (see Methods) after which the cells were incubated at 37°C for 20 min. Initial plasma membrane expression was determined by omitting the 37°C incubation step (T = 0 min, lane 2). The cell surface biotin which remained following endocytosis was stripped (MESNA) after which the endocytosed, biotinylated protein was pulled down using streptavidin-agarose, the proteins separated by SDS-PAGE and blotted for KCa2.3. The efficiency of stripping was determined by subjecting cells to MESNA in the absence of a 37°C endocytosis step (control, lane 1). Lane 3 demonstrates the amount of KCa2.3 endocytosed in 20 min (T = 20 min). The ratio between the amount of KCa2.3 detected following endocytosis (lane 3) to that at time 0 (lane 2) was determined by densitometry and plotted as % endocytosis in D. Expression of K44A dynamin resulted in a significant decrease of KCa2.3 endocytosis, relative to WT dynamin (n = 3; *p<0.05). Densitometry is expressed as mean ± SEM.

