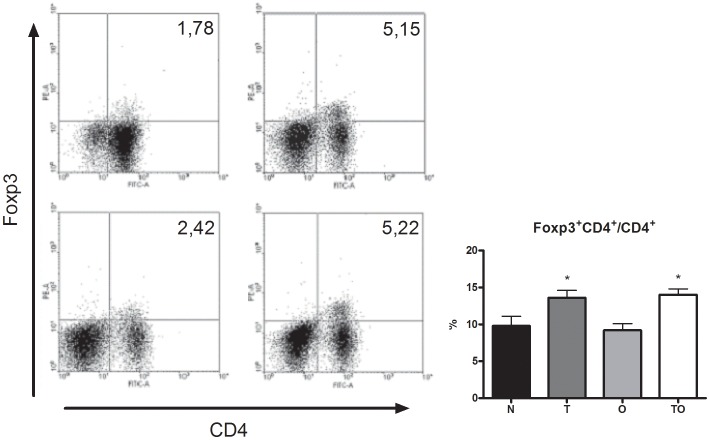
Figure 5. Expansion of Treg CD4+FoxP3+ cells.
Flow cytometry analysis of TLN cells from naïve (N), T. gondii infected (T), allergic (O) and T. gondii infected/OVA sensitized mice (TO) stained with anti-CD4 and Foxp3. Representative dot blots from each group (A) and bar charts showing percentage of TLN cells expressing Foxp3 on CD4+ subset (B). *p<0.05 T and OT vs both N and O groups; ANOVA with Bonferroni a posteriori.

