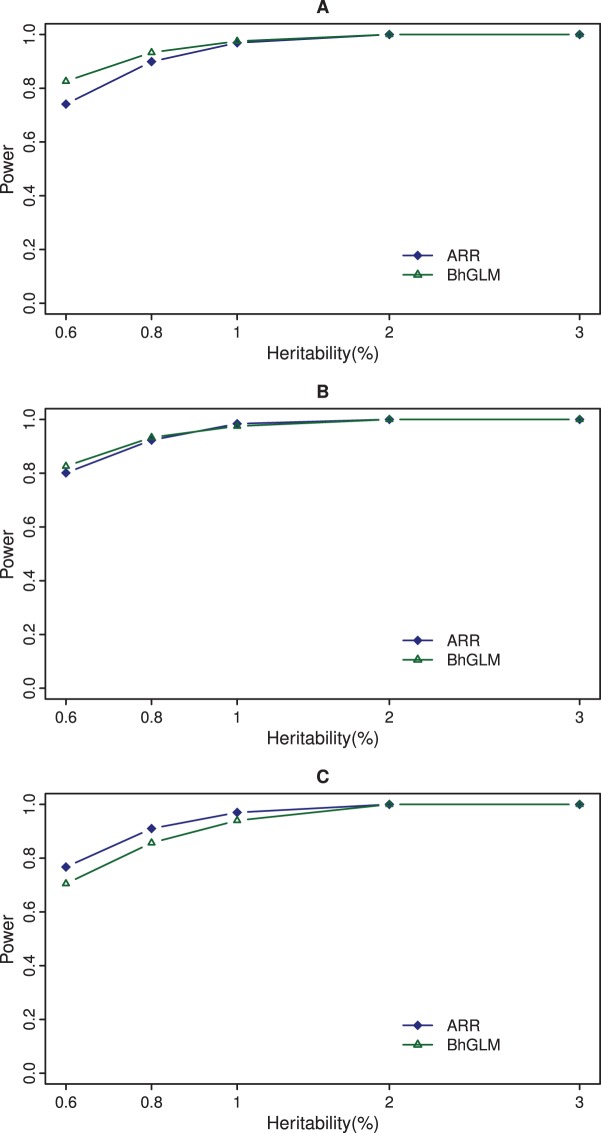
Figure 3. Power comparison between ARR and BhGLM at significance level of 0.05.
The top panel (A) gives the powers of the adaptive ridge regression (ARR) and the Bayesian hierarchical generalized linear model (BhGLM) evaluated at the threshold of 3.84. The panel in the middle (B) shows the powers of ARR and BhGLM evaluated at the threshold 2.71 for ARR and 3.84 for BhGLM. The bottom panel (C) shows the powers of ARR and BhGLM using thresholds of 3.45 and 9.78, respectively, to control the 0.05 Type I error rate.

