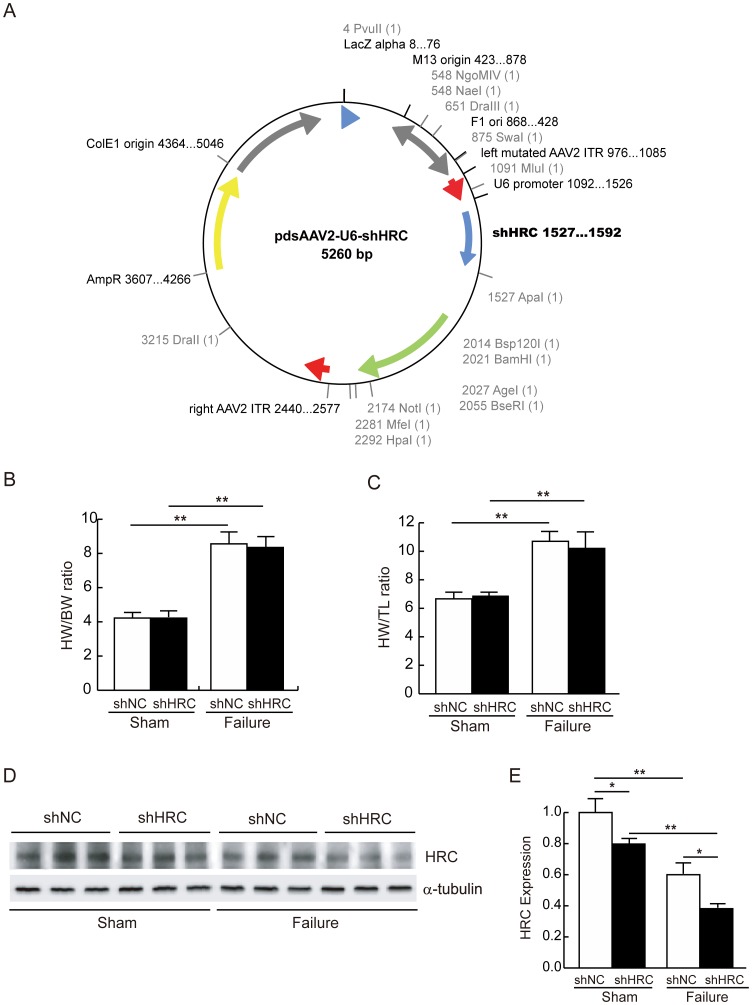
Figure 5. AAV9 virus -mediated HRC-KD in sham and TAC-FH samples.
A: Schematic figure for the construction of shNC- and shHRC-AAV9 viruses. B: Heart weight per body weight (HW/BW) ratio after 11 weeks of TAC operation. C: Heart weight per tibia length (HW/TL) ratio after 11 weeks of TAC operation. D: Western blot result of HRC expression from 4 groups, shNC sham, shHRC sham, shNC failure and shHRC failure. E: Summarized data for HRC expression (*P<0.05, **P<0.01). Note that the HRC expression was down-regulated both in sham and failure samples.

