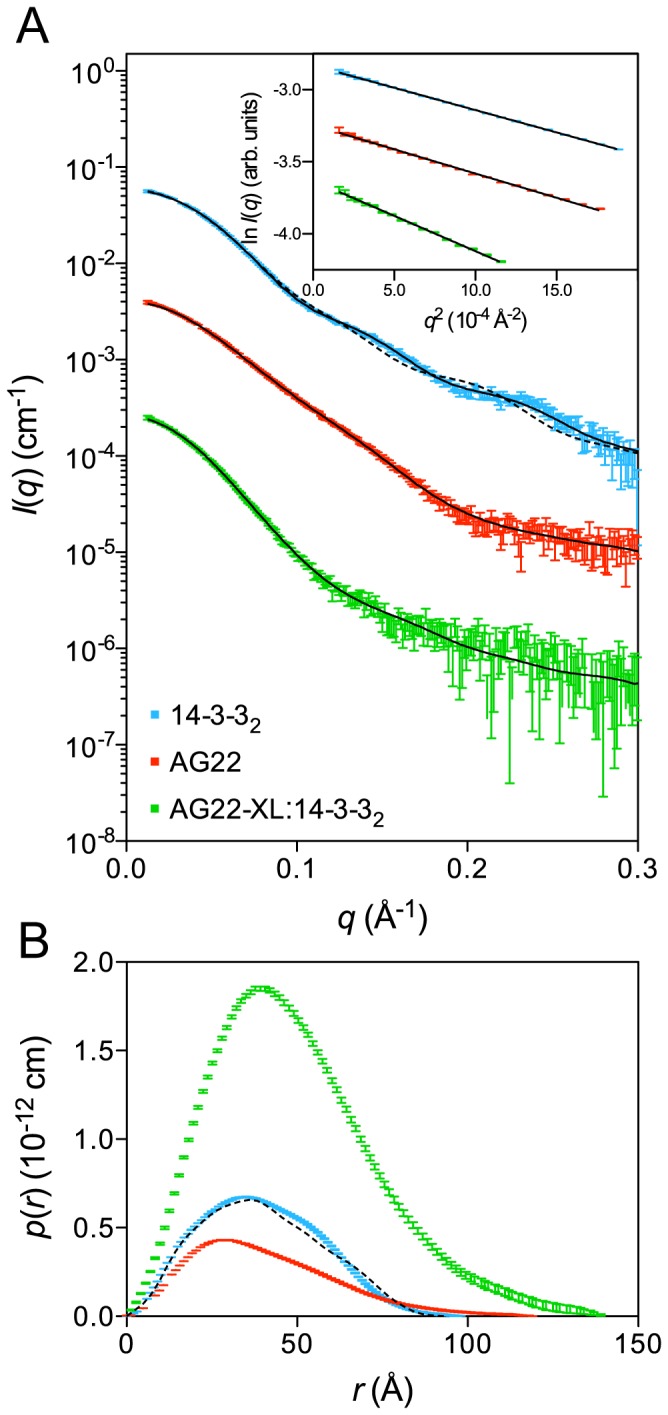
Figure 4. Small angle X-ray scattering data for AG22 (1–422) S16D/S411D and 14-3-3.

A. The measured scattering data for 14-3-3 (blue), AG22 (1–422) S16D/S411D (red – offset by a factor of 10−1), purified cross-linked AG22 (1–422) S16D/S411D:14-3-32 complex (green – offset by a factor of 10−2) overlaid with the SAXS profiles of the optimized models (solid black lines: χ 2(14-3-3) = 1.3; χ 2(AG22 (1–422) S16D/S411D) = 1.1; χ 2(AG22 (1–422) S16D/S411D:14-3-32 cross-linked complex) = 0.9). Also overlaid is the predicted scattering profile for the 14-3-3 crystal structure (black dotted line: χ 2(PDB: 2BQ0) = 7.4). Inset: Guinier plots of the low-angle portion of the scattering data are linear consistent with monodisperse solutions. B. Pair-distance distribution functions derived from the scattering data using GNOM [31]. The predicted p(r) profile for the 14-3-32 crystal structure (black dotted line) is shown for comparison. Colouring scheme is the same as for panel A. This shows as expected that the complex is larger than the AG22 (1–422) S16D/S411D or 14-3-3 molecules on their own.
