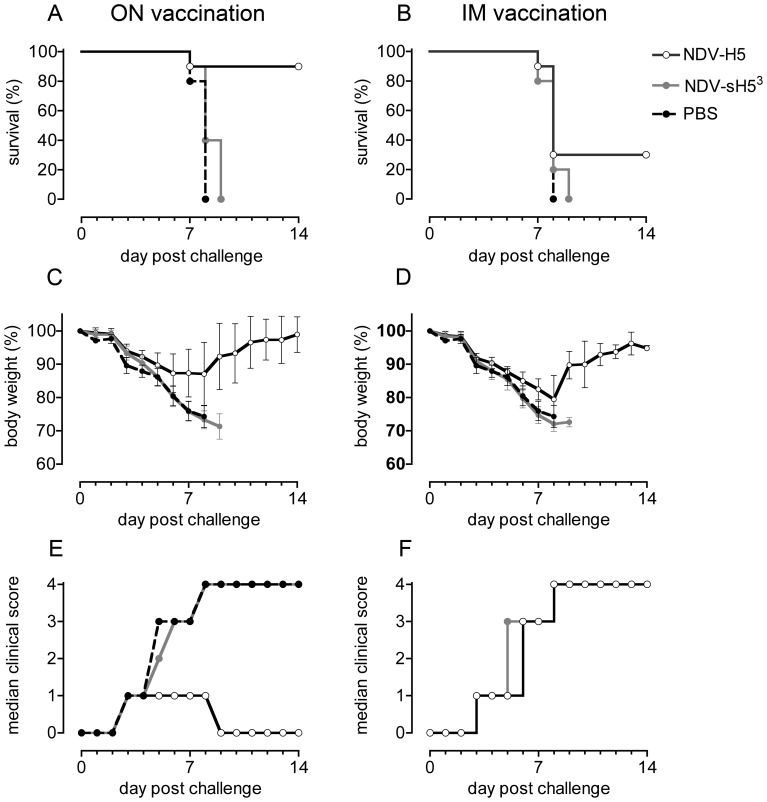
Figure 4. Vaccination of mice.
Groups of 10 BALB/c mice were vaccinated with 106.5 TCID50 of NDV-H5 or NDV-sH53, either via the ON or IM route. One group of mice was mock-vaccinated (PBS) as challenge control. Three weeks after the vaccination, mice were infected with ∼10 LD50 of HPAIV H5N1 and weighed daily and observed for clinical signs during 14 days. Graphed for each group are A and B) Kaplan-Meier survival curves indicating percentage of survival p.c., C and D) mean percentage of body weight changes relative to starting weights measured on the day of challenge (day 0) with error bars representing the standard deviation, and E and F) median clinical scores observed after challenge. For reference, each panel includes the same PBS group.

