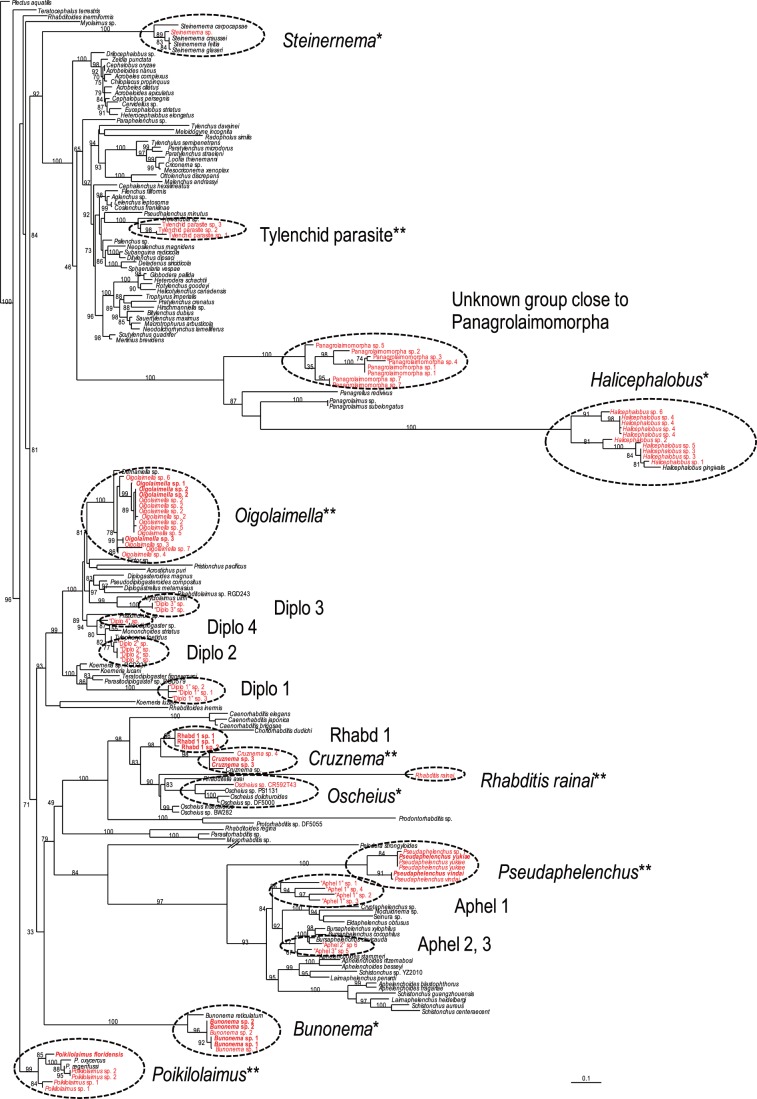
Figure 1. Molecular phylogenetic relationship among MOTUs and the SSU sequences stored in the GenBank database.
The 100001st Bayesian tree inferred from MOTUs and SSU sequences under GTR+I+G model (lnL = 30163.4492; freqA = 0.2367; freqC = 0.2089; freqG = 0.2585; freqT = 0.2959; R(a) = 1.1766; R(b) = 2.7362; R(c) = 1.8858; R(d) = 0.6747; R(e) = 4.2046; R(f) = 1; Pinva = 0.1854; Shape = 0.57). Posterior probability values exceeding 50% are given on appropriate clades. Successfully cultured species are written in bold. *: Identified solely by molecular sequence; ** : identified based on morphological observation.

