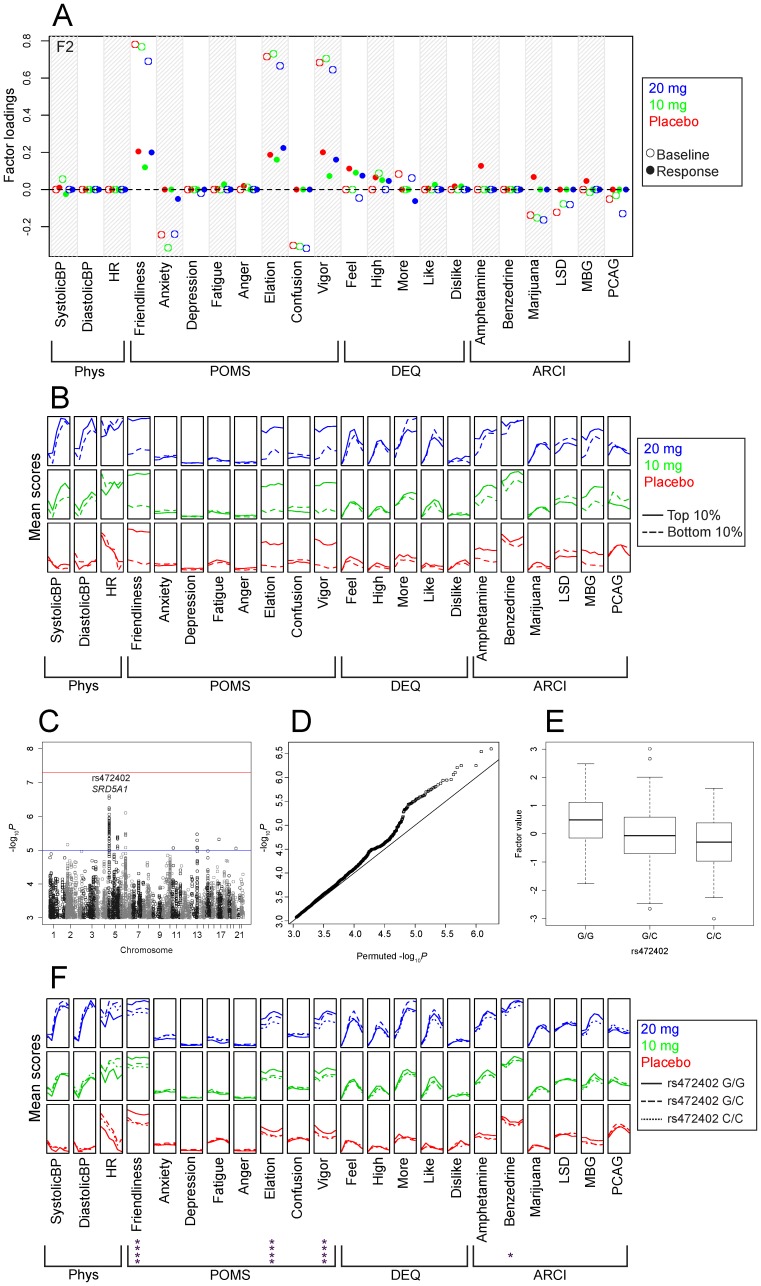
Figure 3. Potential association of rs472402 (SRD5A1) with the positive affect baseline factor.
Panel A shows the factor loadings for factor F2; abbreviations of outcome measures are defined in the text. Panel B shows the raw phenotype scores as a function of dose (denoted by color coded vertically stacked panels) and time (x-axis within each panel) for individuals in the upper and lower deciles of this factor. Panel C shows the association between factor F1 and each SNP (expressed as −log10 P), the most significant association was on chromosome 5 at rs472402 (P = 2.53×10⁻⁷). The red horizontal line indicates 5×10⁻⁸, which is often used as a threshold for significance. The blue horizontal line indicates 1×10⁻⁵, which could be considered a threshold for suggestive evidence. Panel D shows a Q-Q plot of observed −log10 P versus the average −log10 P from ten random permutations. Panel E shows a boxplot of the values for factor F1 stratified by genotype. The width of each box corresponds to number of observations at the corresponding genotype. Panel F shows the raw phenotype scores stratified by genotypes as a function of dose and time. Asterisks indicate a significant main effect of genotype in a 3×3×6 repeated measures ANOVA using age, sex, BMI, and the first two principal components as covariates. * P≤0.05; **** P≤10−4.

