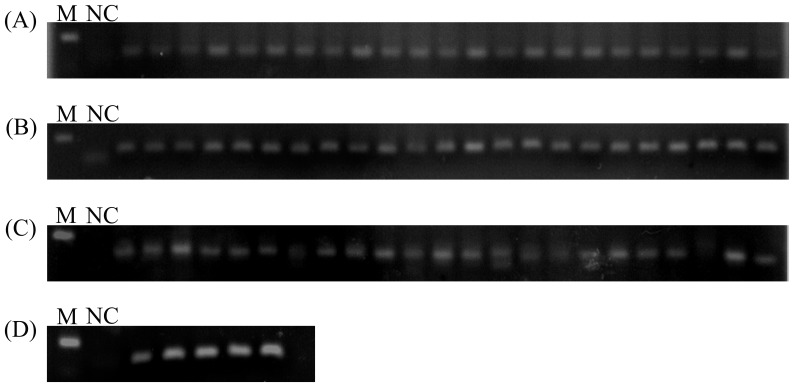
Figure 3. Stem-loop RT-PCR analysis of novel miRNAs expression with 30 cycles.
(A) line 2–24 indicated novel miRNA from novel01 to Novel24; (B) line 2–24 indicated novel miRNA from novel25 to Novel50; (C) line 2–24 indicated novel miRNA from novel51 to Novel74; (D) line 2–6 indicated Novel75, Csi-miR156, Csi-miR172, miR396 and PtmiR93; NC indicated negative control; M indicated 100 bp.

