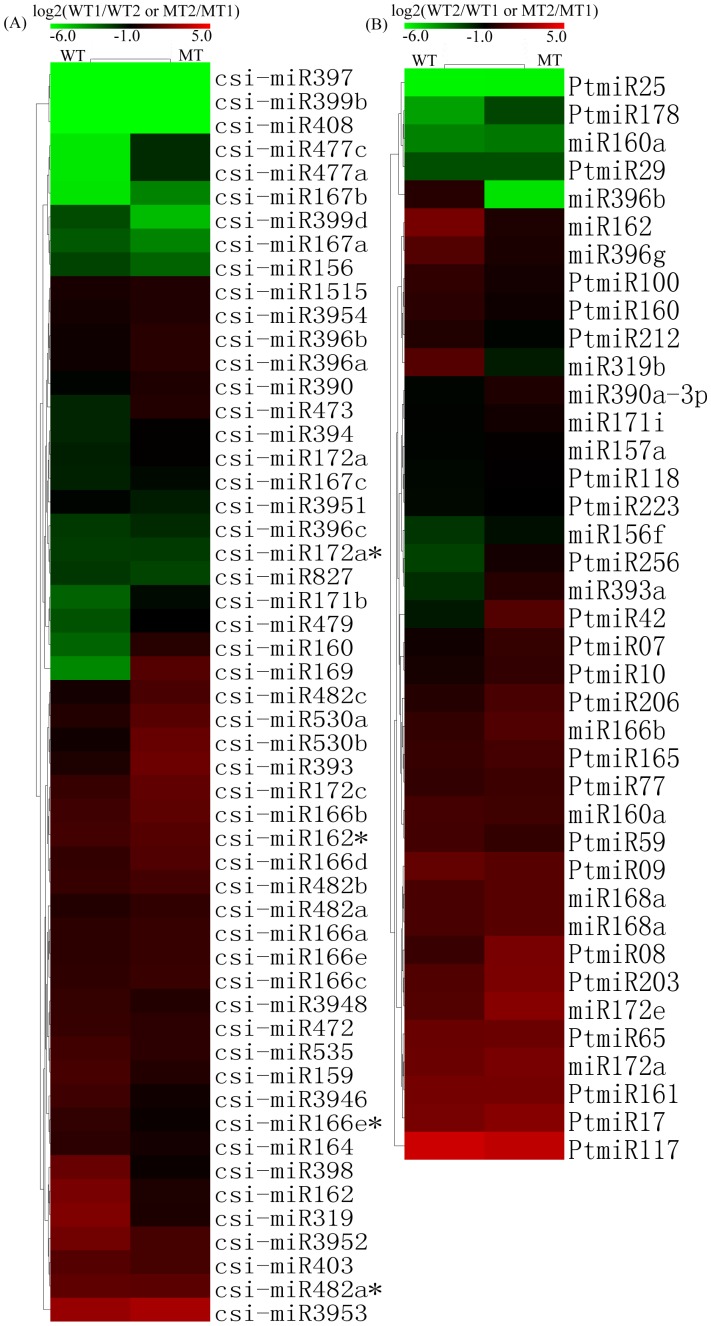
Figure 4. Expression patterns of the known miRNAs at different developmental stages.
Several miRNA*s were included. Unsupervised hierarchical cluster analysis of two set array data (MT and WT), each column represents a sample, and each row represents a single miRNA. The bar represented the scale of relative expression levels of miRNAs, and colors indicate relative signal intensities.

