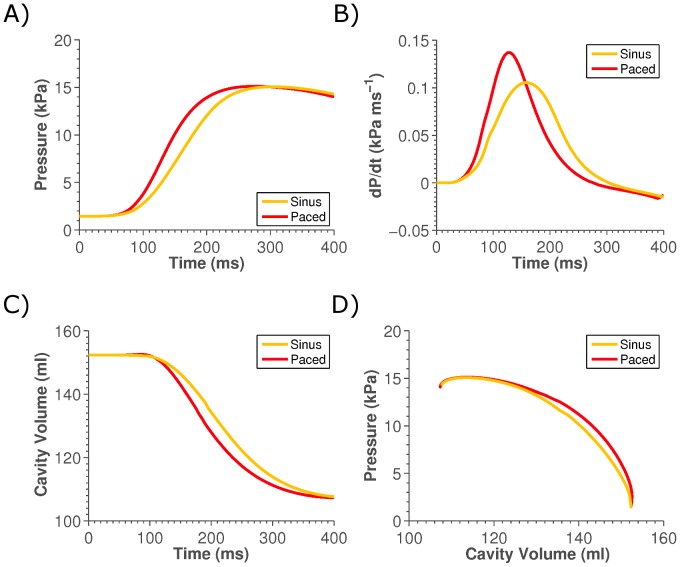
Figure 2. Plot of changes in global metrics of cardiac function following LV pacing. Panel A), B) and D) show the change in left ventricle pressure, rate of pressure development and volume, respectively, on pacing.
Panel D) shows the phase plot of pressure and volume, where the area enclosed beneath the lines is equal to the work performed.

