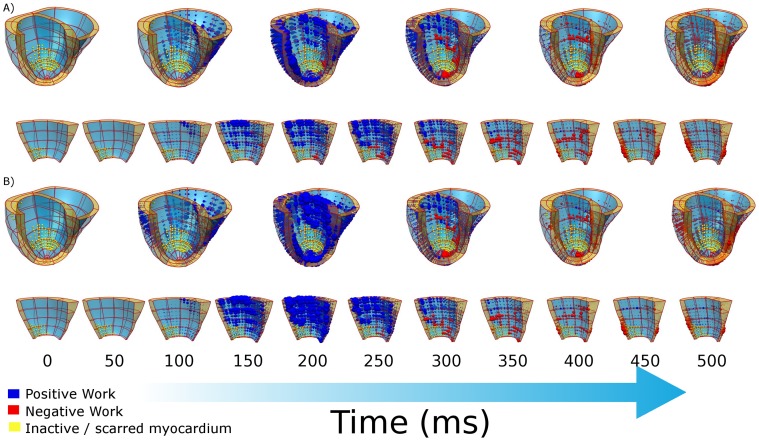
Figure 3. Plot of local work (A) pre- and (B) post-CRT, yellow spheres correspond to regions of scar that perform no work.
Blue spheres and red spheres correspond to regions performing positive and negative work, respectively and the size of the sphere corresponds to the magnitude of the work rate. Panels A) and B) show in the first row the local work in the whole heart at 100 ms intervals, and in the second row a close up of the septum at 50 ms intervals.

