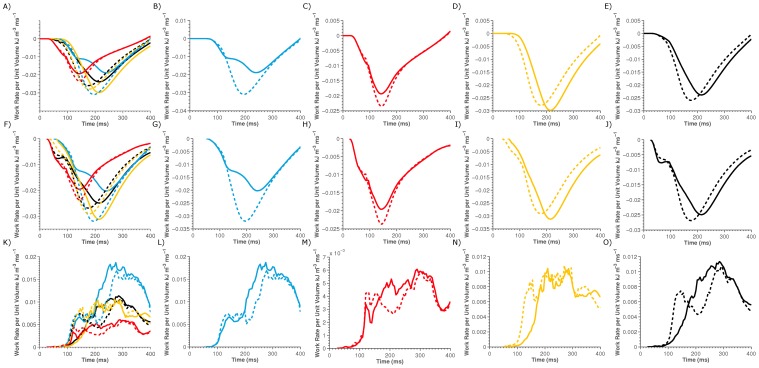
Figure 5. Plot of regional work rates for the LV (yellow lines), RV (red lines), septum (blue lines) and the whole heart (black lines) for sinus rhythm (solid lines) and for LV pacing (dashed lines).
Panel A) compares the total work density. Panels B–E) separates Panel A) into regional plots of Septum, RV, LV and whole heart work densities individually for sinus rhythm and LV pacing. Similarly Panel F–J) compares the total work density in volumes of the heart that are performing positive work and Panel L–O) compares the regional work performed in volumes of the heart performing negative work.

