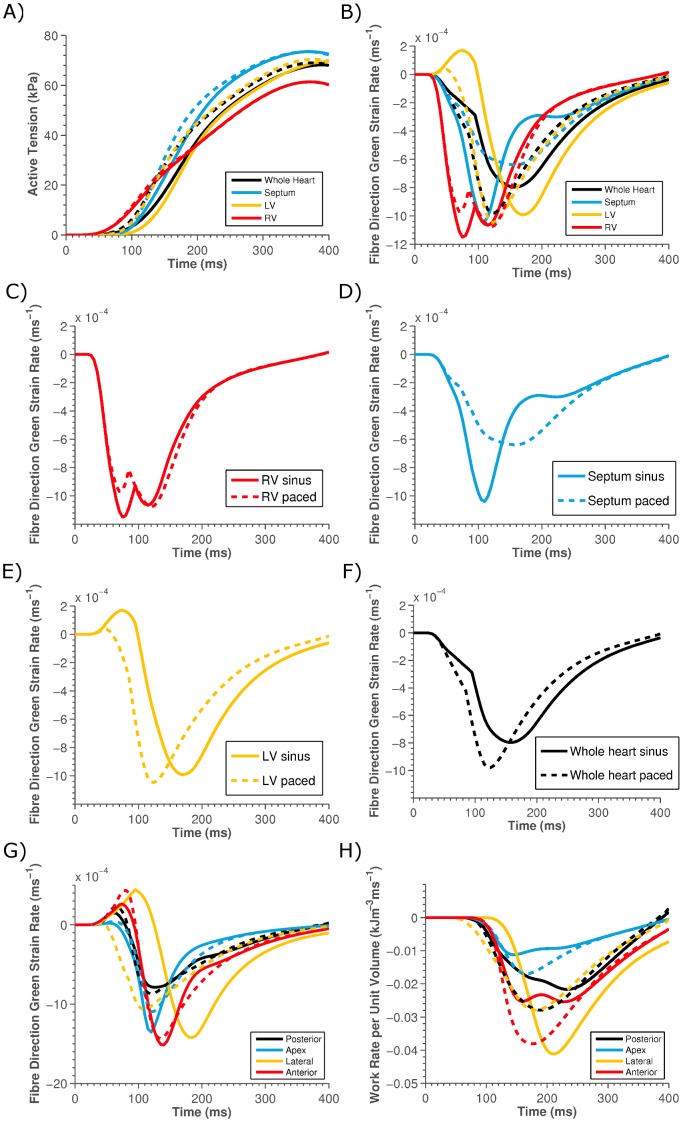
Figure 6. Plot of the average A) active-tension and B) fibre SR in the LV (yellow lines), RV (red lines), septum (blue lines) and the whole heart (black lines) for sinus rhythm (solid lines) and for LV pacing (dashed lines).
Panels C–F) show the individual plots from Panel B) for clarity. Panels G) and H) show the average work rate and the average SR, respectively, in the posterior (black), apex (blue), lateral (yellow) and anterior (red) LV free wall for sinus (solid) and paced (dashed) stimulation.

