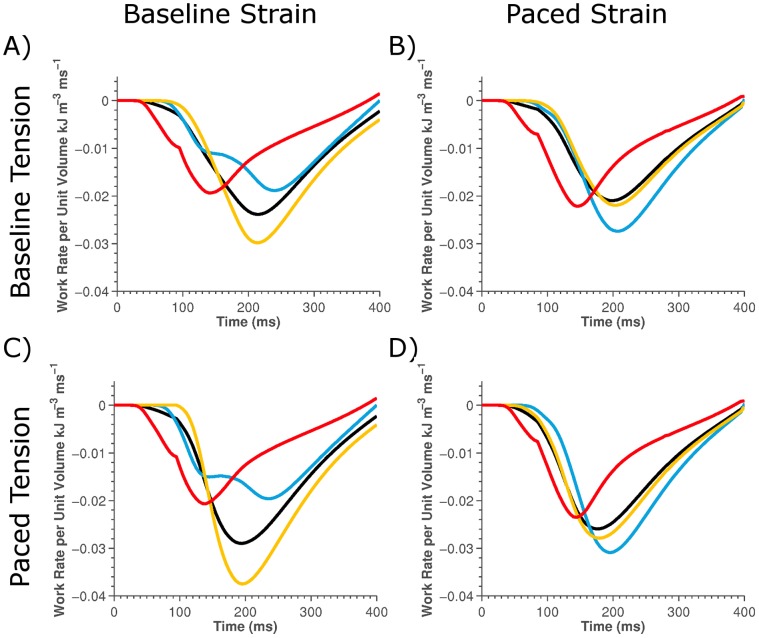
Figure 7. Plot off the regional work rate calculated in the LV (yellow lines), RV (red lines), septum (blue lines) and the whole heart (black lines).
The regional work rate was calculated using the SR from the sinus and paced model for the left and right plots, respectively and the tension from the sinus and paced models for the top and bottom plots, respectively.

