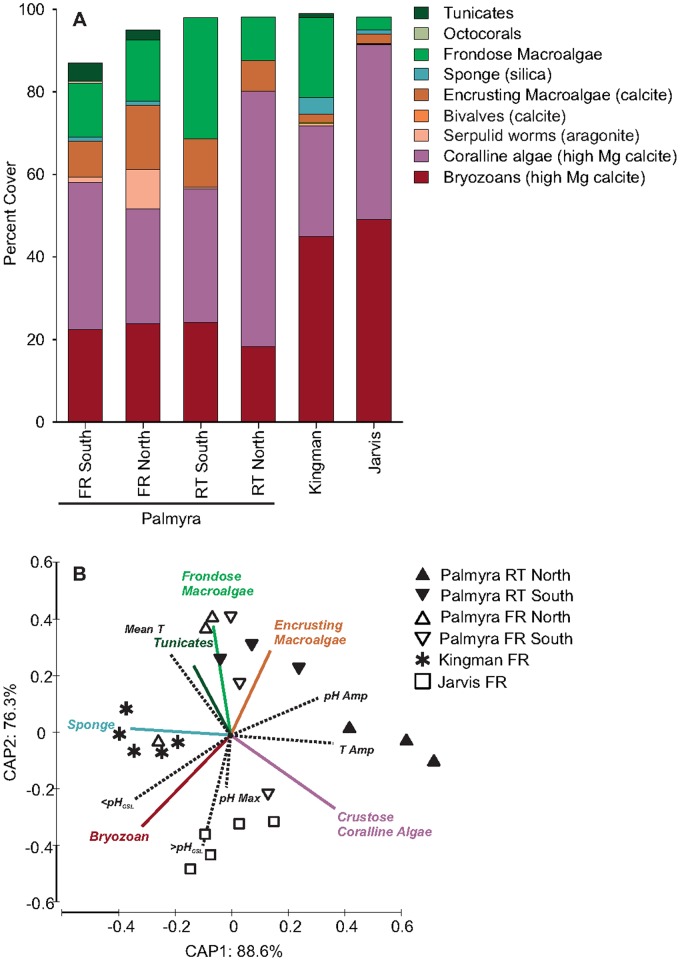
Figure 2. Results of image analyses on Calcification Acidification Units (CAUs).
a) Percent cover of the various ecological functional groups. Green bands = ‘fleshy’ invertebrate and algae species. The mineralogy for calcifying species is indicated in the figure legend. b) Original variable vectors of the CAP analysis overlaid as a bi-plot (Spearman Rank correlations >0.5) for both the biological and physio-chemical data from each site. The biological vector colors correspond to functional groups listed in (a).

