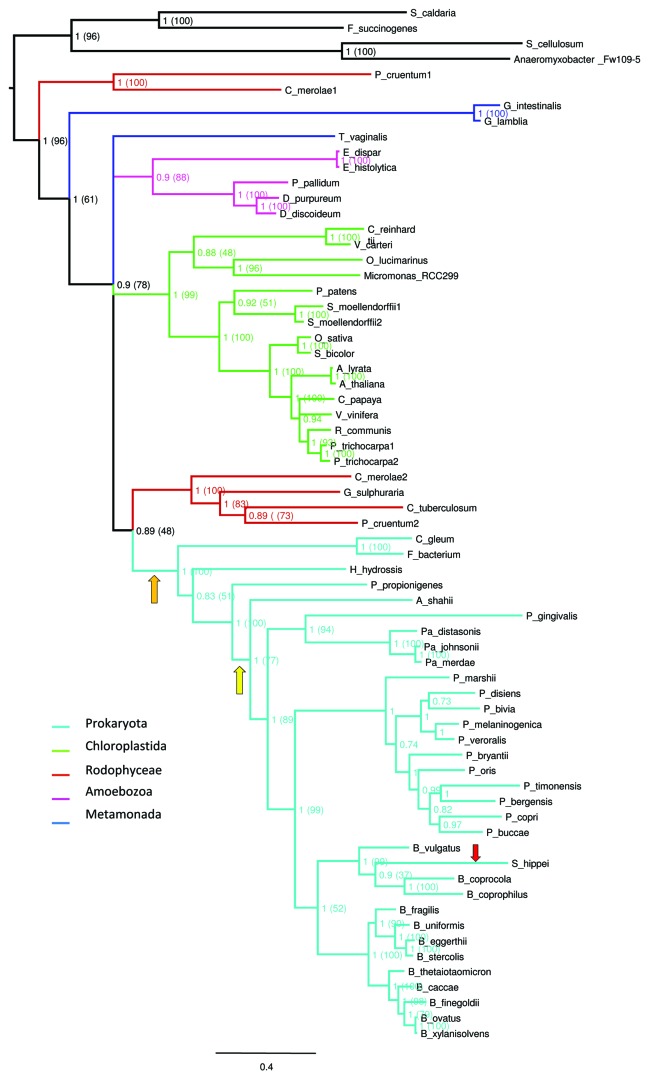
Figure 2. Phylogenetic analyses of the DPE2-like sequences. Representation of the phylogenetic tree was generated by FigTree (http://tree.bio.ed.ac.uk/software/figtree/), the different branch colors correspond to the different taxa further detailed in Table 1. The Bayesian topology was chosen as a reference and, overall, it corresponds to that of the maximum likelihood (ML) consensus trees. Supporting posterior probability values are indicated at each node and the corresponding bootstrap support values from the ML analysis are reported in parentheses. The orange arrow indicates the LGT from the eukaryotes to environmental bacteria, the yellow arrow the LGT from environmental bacteria to gut bacteria and the red arrow the LGT from Bacteroides to Proteobacteria.

An official website of the United States government
Here's how you know
Official websites use .gov
A
.gov website belongs to an official
government organization in the United States.
Secure .gov websites use HTTPS
A lock (
) or https:// means you've safely
connected to the .gov website. Share sensitive
information only on official, secure websites.
