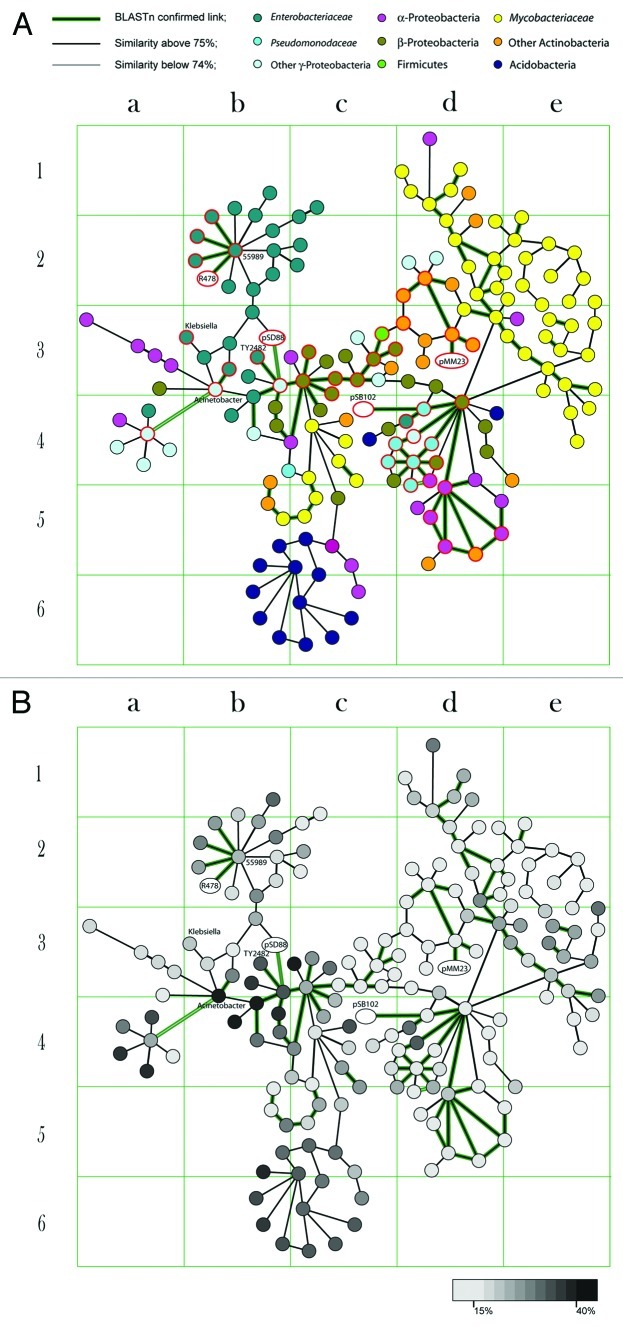
Figure 1. The figure illustrates the grouping of GIs which share similarities in both composition and sequence. Each node corresponds to one GI. Nodes sharing compositional similarity of 75% and above are linked by edges. As it was shown previously, this level of compositional similarity implies common ancestry between mobile genomic elements.8 Plasmid genomes are depicted by ovals. More details about these GIs are available on an interactive map at www.bi.up.ac.za/SeqWord/maps/map.html. (A) Nodes are colored according to the taxonomic belonging of the host microorganisms. (B) Grey gradient colors depict divergence of GI pattern from the tetranucleotide usage pattern of the host chromosome.

An official website of the United States government
Here's how you know
Official websites use .gov
A
.gov website belongs to an official
government organization in the United States.
Secure .gov websites use HTTPS
A lock (
) or https:// means you've safely
connected to the .gov website. Share sensitive
information only on official, secure websites.
