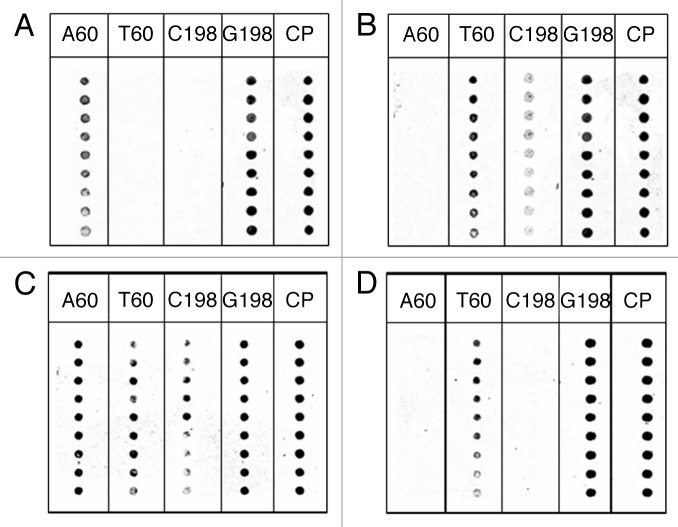
Figure 7. PNA array analysis of 296 bp PCR amplicons from olive leaves shown in Figure 6. (A) Ogliarola Leccese; (B) Canino; (C) mix, mixture 50–50% of both cultivars; (D) Frantoio. Spots in each column represent replicates.

An official website of the United States government
Here's how you know
Official websites use .gov
A
.gov website belongs to an official
government organization in the United States.
Secure .gov websites use HTTPS
A lock (
) or https:// means you've safely
connected to the .gov website. Share sensitive
information only on official, secure websites.
