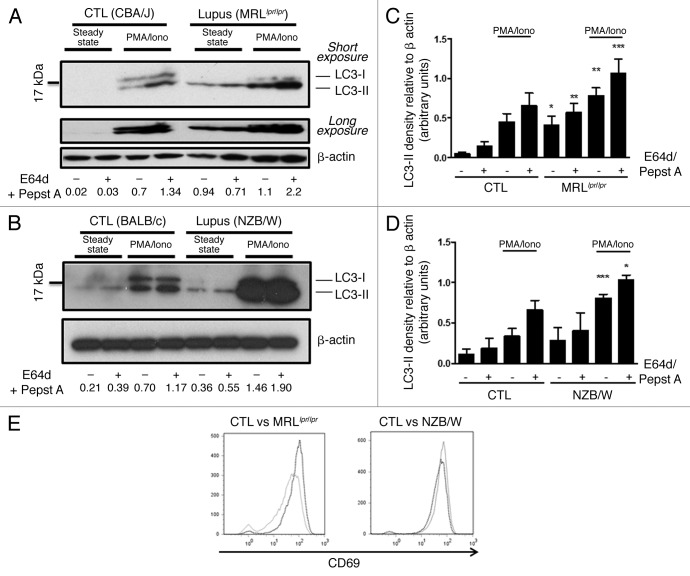
Figure 2. Autophagic activity in peripheral T cells from lupus-prone mice is raised compared with controls T cells sorted from spleens obtained from 8–12 week-old control CBA/J and lupus MRLlpr/lpr mice (A) or from 12–20 week-old control BALB/c and lupus NZB/W mice (B) were left unstimulated (steady-state) or stimulated by 50 ng/mL PMA and 1 µM Ionomycin (PMA/Iono) at 37°C for 16h. When indicated, cells were treated (+) or not (-) during the last 4 h of the culture with 5 µg/mL pepstatin A and 5 µg/mL E64d to block lysosomal degradation. Cell lysates were resolved by SDS-PAGE, transferred onto PVDF membranes before staining with anti-LC3 Ab. Loading controls were performed by staining actin-β chain. Each immunoblot is representative of at least five independent experiments with identical results. *Band corresponding to the Ig heavy chain retained in lysates obtained from oldest lupus mice. LC3-II/β-actin band intensity ratios are indicated as numbers under each immunoblot. (C and D) LC3-II levels were evaluated by densitometry and normalized to β-actin band intensities for at least five independent experiments. Histogram bars represent the means of individual experiments with standard errors. *p < 0.05, **p < 0.01, ***p < 0.001 using paired t-test between control and lupus conditions. Activation of sorted T cells from control and lupus mice was assessed by flow cytometry with CD69 staining (E). Dotted black lines and solid gray lines represent respectively control and lupus mice.

An official website of the United States government
Here's how you know
Official websites use .gov
A
.gov website belongs to an official
government organization in the United States.
Secure .gov websites use HTTPS
A lock (
) or https:// means you've safely
connected to the .gov website. Share sensitive
information only on official, secure websites.
