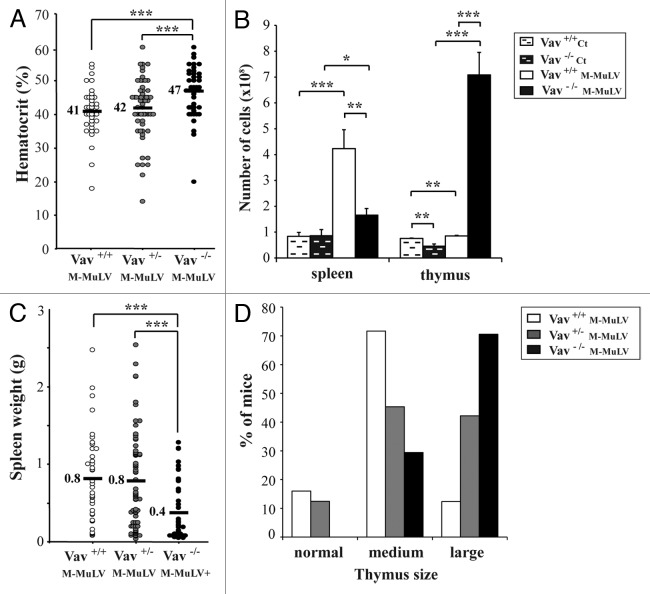
Figure 2. Phenotype of M-MuLV-infected mice. Mice described in Figure 1 were analyzed for tumor phenotype. A) Hematocrits in the different mice populations were monitored one day before euthanasia. B) Spleen and thymus cellularity in M-MuLV-infected mice. C) Spleen weights in different mice populations. D) Size of thymi in different mice populations. Data were evaluated using Student’s t-test: * p < 0.05; **p < 0.01; ***p < 0.001.

An official website of the United States government
Here's how you know
Official websites use .gov
A
.gov website belongs to an official
government organization in the United States.
Secure .gov websites use HTTPS
A lock (
) or https:// means you've safely
connected to the .gov website. Share sensitive
information only on official, secure websites.
