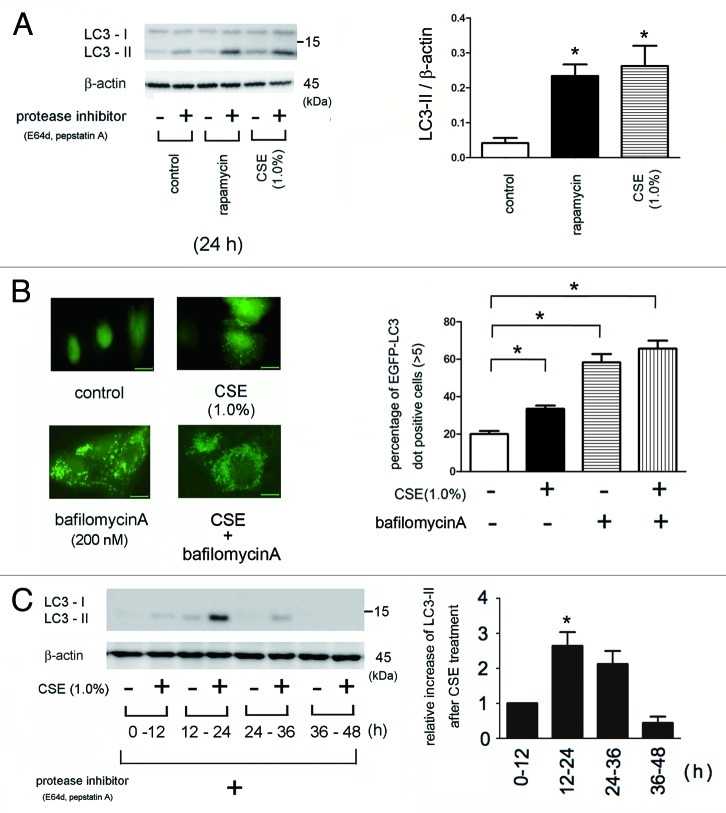
Figure 1. Autophagy activation in response to CSE exposure. (A) western blotting (WB) using anti-LC3 and anti-β-actin in control treated (lane 1, 2), rapamycin treated (1 μM) (lane 3, 4), CSE treated (lane 5 to 6) in the presence or absence of protease inhibitors (E64d 10 μg/ml and pepstatin A10 μg/ml) in Beas2B cells. Protein samples were collected after 24 h treatment with indicated concentrations of CSE. Shown is a representative experiment of three similar results. The right panel is the densitometric analysis of WB from three independent experiments. LC3-II / β-actin in the presence of protease inhibitors was subtracted by LC3-II / β-actin without protease inhibitors. *p < 0.05. (B) Fluorescence microscopic detection of pEGFP-LC3 dot formation in BEAS-2B cells: BEAS-2B cells with stable expression of pEGFP-LC3 were treated with bafilomycin A (200 nM), CSE (1.0%), or both bafilomycin A and CSE for 24h. Photomicrographs are taken at the same magnification. (Original magnification, 1000X) Bar = 10μm. The right panel is the percentage of positive cells with more than five dot formations and data were collected from three independent experiments. *p < 0.05. (C) WB using anti-LC3 and anti-β-actin for indicated time points of control or CSE (1.0%) treatment in the presence of protease inhibitors (E64d and pepstatin A) in HBEC from non-COPD patients. CSE treatment was started from 0h to sample collection and protease inhibitors were added during indicated time period. Shown is a representative experiment of three similar results. The lower panel is the relative increase of LC3-II after CSE exposure taken from densitometric analysis of WB. *p < 0.05.

An official website of the United States government
Here's how you know
Official websites use .gov
A
.gov website belongs to an official
government organization in the United States.
Secure .gov websites use HTTPS
A lock (
) or https:// means you've safely
connected to the .gov website. Share sensitive
information only on official, secure websites.
