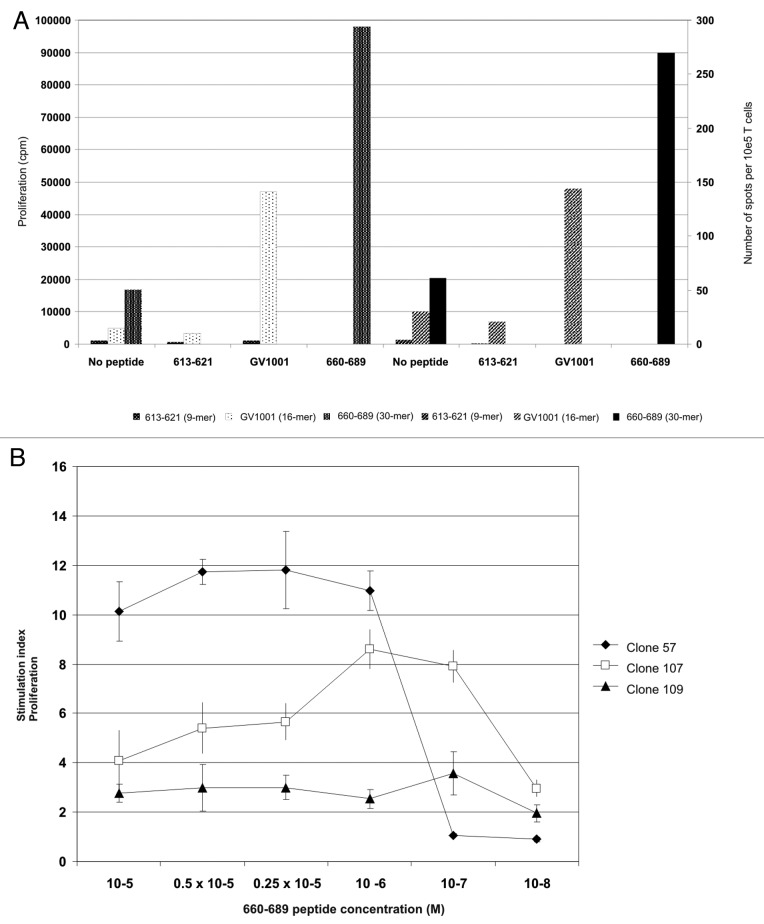
Figure 5. Peptide-specific T-cell proliferation correlates with IFN-γ secretion and give rise to high affinity CD4+ T-cell clones. (A) shows hTERT-specific T-cell proliferation and IFN-γ production in response to peptide-loaded autologous PBMC. The x-axis shows peptide, the Y axis proliferation measured in cpm and the z-axis shows number of spots detected per 105 T cells in an IFN-γ ELISPOT on the same cells. White dotted bars represent proliferation of 613–621-stimulated T cells, black dotted bars the proliferation of GV1001-stimulated T cells, and small-dotted bars 660–689-stimulated T cells, respectively. Large hatched bars represent the IFN-γ secretion from 613–621-stimulated T cells, small hatched bars the GV1001-stimulated T cells and black bars the 660–689-stimulated T cells, respectively. (B) shows proliferation of three representative CD4+ T-cell clones against autologus EBV-LCL loaded with titrated concentrations of peptide 660–689. Closed squares show T cell clone 57, open squares show T cell clone 107 and closed triangles show T cell clone 109.

An official website of the United States government
Here's how you know
Official websites use .gov
A
.gov website belongs to an official
government organization in the United States.
Secure .gov websites use HTTPS
A lock (
) or https:// means you've safely
connected to the .gov website. Share sensitive
information only on official, secure websites.
