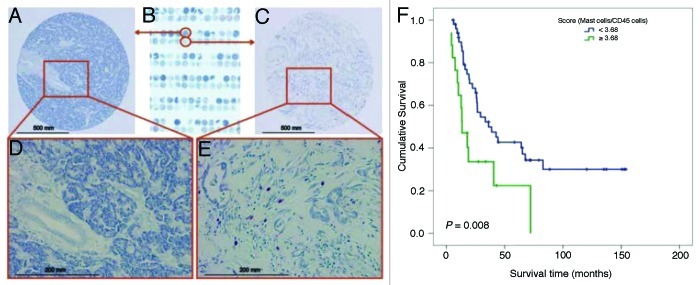
Figure 1. Association of mast cell infiltration with survival of patients with PDAC. No mast cells were found in NP tissues. (A) 100x and (D) 400x. (B) A human PDAC tissue microarray was stained with toluidine blue. Mast cells were found in the human PDAC tumor microenvironment: (C) 100x and (E) 400x. Mast cells stained red-purple (metachromatic staining), and the background was blue (orthochromatic staining). (F) The mast cell score was correlated with survival in patients with PDAC. The mast cell score was normalized as the ratio of the number of mast cells to the percentage of pan-leukocytes (CD45-positive cells). The cutoff point of the mast cell score was set at 3.68. Upper curve, patients with mast cell scores < 3.68; lower curve, patients with mast cell scores ≥ 3.68. The p value was derived using the log-rank statistic.

An official website of the United States government
Here's how you know
Official websites use .gov
A
.gov website belongs to an official
government organization in the United States.
Secure .gov websites use HTTPS
A lock (
) or https:// means you've safely
connected to the .gov website. Share sensitive
information only on official, secure websites.
