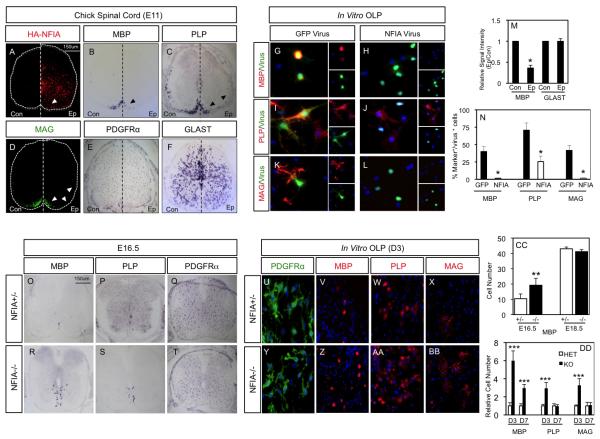
Figure 4. NFIA suppresses OLP differentiation during embryogenesis.
(A-F) Overexpression of NFIA in the embryonic chick spinal cord at E11. (A) Ectopic expression of RCAS/HA-NFIA, detected with α-HA. (B-D) Analysis of myelin gene expression in the presence of ectopic NFIA, arrows denote reduced expression. (E-F) Expression of astrocyte prescursor marker GLAST (F), and OLP marker PDGFRα E is unaffected by ectopic NFIA; quantification of MBP and GLAST (M). (G-L) Overexpression of NFIA in OLP culture suppresses myelin gene expression. (G,I,K) GFP-control virus, (H,J,L) NFIA virus; quantification of myelin gene expression (N). In M and N, *p<.005. (O-T) Analysis of OL differentiation in NFIA +/− and NFIA−/− embryos at E16.5; (CC) quantification of the number of MBP-expressing cells. (U-BB) In vitro analysis of OL differentiation using NFIA +/− (U-X) and NFIA−/−(Y-BB) OLP cultures. (DD) Quantification of number of cells expressing myelin genes. For A-F, “Ep” denotes the electroporated side and “Con” denotes the control side of the embryo. Quantification in M is from 3 embryos, 10 sections per embryo. Analysis of NFIA+/− and −/− embryos in O-T is derived from three litters for each timepoint and is comprised of at least three embryos per genotype. In vitro analysis was performed in triplicate on three sets of embryos derived from two litters. Quantification in N and DD is derived from experiments performed three times, in triplicate. In CC, **p=.017 and in DD, ***p<.003. All error bars indicate SD.

