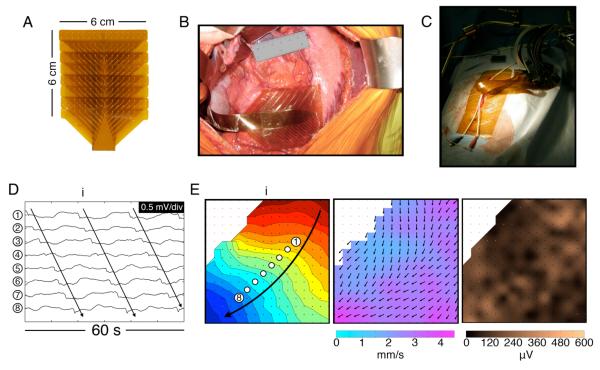
Figure 1.
HR mapping methods. A. Flexible PCB array (16×16 electrodes at 4 mm spacing). B. Photo of the array placed on the corpus-antrum border. C. During mapping, the wound edges were approximated and cables fixed to a retractor. D. Electrograms from 8 channels from the positions indicated in (E) (frequency 3.2 ± 0.1 SD c/min) (Patient ID#3 in Suppl. Table 2). E. Left: isochronal activation map of the wavefront (i) indicated in (D), showing normal propagation. Each dot represents an electrode, and each color band shows the area of slow-wave propagation per 2 s (the ‘isochronal interval’). An animation sequence of this data is presented in Figure1.wmv. Middle: Velocity field map of the same wavefront (i), showing the speed (color spectrum) and direction (arrows) of the wavefront at each point on the array. Propagation is faster nearer the greater curvature 16. Right: Amplitude map of the same wavefront (i).

