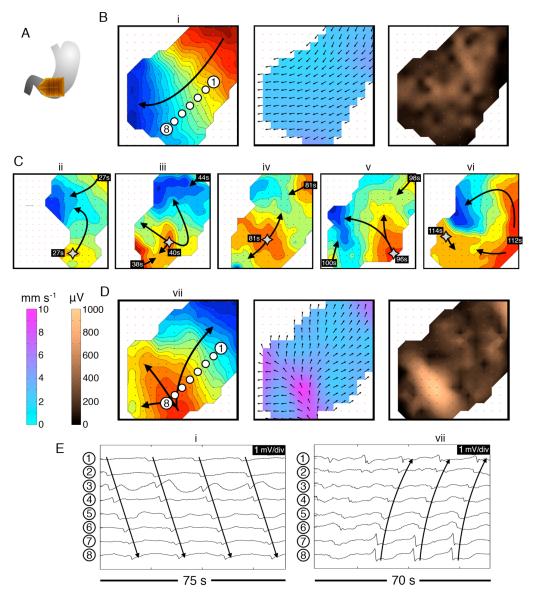
Figure 4.
Abnormal slow-wave initiation: unstable focal events and stable ectopic pacemaking; examples from diabetic gastroparesis (ID#5). Isochronal intervals = 1 s. A. Position diagram. B. Normal activity was initially mapped for 280 s (freq. 3.3 ± 0.1 SD c/min). Isochrone, velocity and amplitude maps are shown for example wave (i) (see also animation Figure4i.wmv). C. An irregular tachygastria followed, due to unstable ectopic events arising at multiple locations (stars; duration ~200 s). Isochronal maps of 5 representative cycles (ii-vi) demonstrate chaotic tissue activation and wave collisions, resulting in a range or frequencies across the mapped field (median 3.7 c/min; range: 1.4 – 5.7). Time stamps are referenced to the accompanying animation (Figure4ii.wmv). D. Regular tachygastria followed, due to stable ectopic activity (freq. 4.0 ± 0.05 SD c/min), with organized retrograde propagation occurring until the end of the recording period. Isochrone, velocity and amplitude maps are shown for example wave (vii) (see also animation Figure 4iii.wmv). During aberrant initiation, circumferential slow-wave propagation emerged, and was faster than normal longitudinal conduction (6.4 ± 2.0 SD vs 2.8 ± 0.7 SD mm s−1; P<0.001), with higher amplitudes (595 ± 225 SD vs 240 ± 150 SD μV; P<0.001). E. Representative electrograms from waves (i) and (vii), from the channels shown in B,D.

