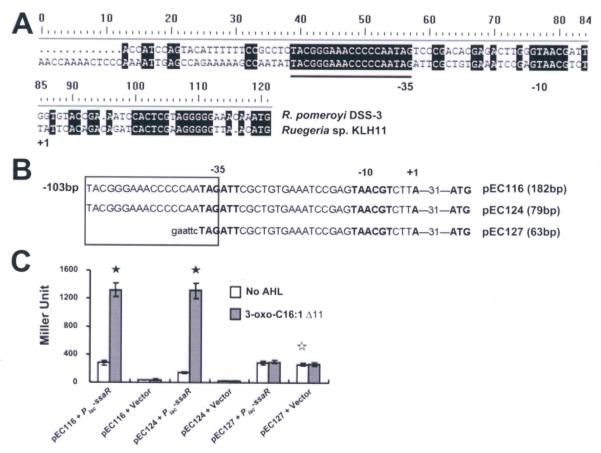
Figure 5. Deletion analysis of the ssaI promoter.
(A) Putative promoter elements are indicated in boldface and putative -35 and -10 regions are indicated below the sequences; +1 indicates the predicted transcription start site. Presumptive Ssa box is underlined. (B) The presumptive ssa box is indicated within the rectangle. Plasmid name and size of insert are indicated adjacent to the translational start site. For the plasmid pEC116, it also included 103 bp upstream of the Ssa box. Lower case sequence indicates an EcoRI restriction site. (C) β-Galactosidase activity of the three deletion constructs fused with the lacZ reporter. All strains derived from Ti-plasmidless A. tumefaciens NTL4. Bars represent the average of three biological replicates and the error bars are standard deviation. The filled asterisks show the statistical significance between samples, with and without 3-oxo-C16:1 (Δ11), in the strains that have SsaR (P<0.001). The unfilled asterisk shows the statistical significance of the basal expression levels between pEC127 and each of pEC116 and pEC127 (P<0.001). The result presented is a representative of several independent experiments each with three biological replicates.

