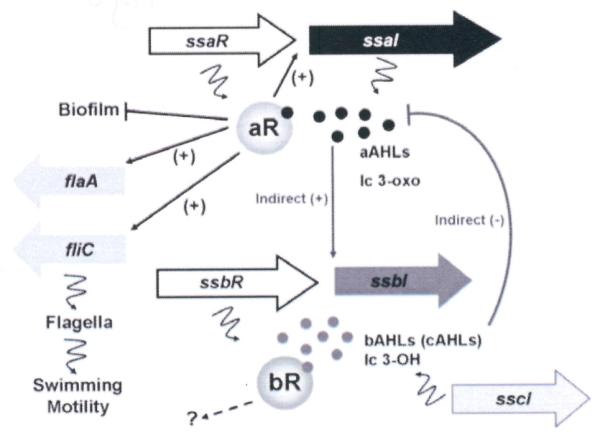
Figure 8. A simplified model for the complex regulatory control of QS circuits in KLH11.

Model depicts a presumptive role of QS in KLH11 dispersal during the interaction between sponge host and symbiont. The ssaRI, ssbR, and sscI genes are drawn according to scale while fliC and flaA are not. The black dots represent the AHLs synthesized by SsaI, mainly long chain (lc) 3-oxo-HSL. The grey dots represent the AHLs synthesized by SsbI, mainly long chain (lc) 3-OH-HSL. The lines with bars indicate inhibition while the arrows indicate activation. Squiggly lines indicate translation of genes or products of enzyme action.
