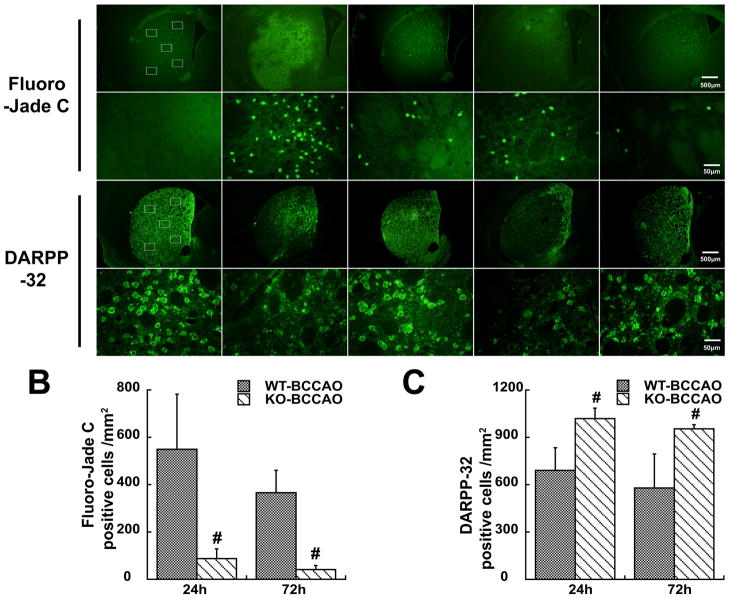
Figure 3.
Fluoro-Jade C and DARPP-32 staining showing neuronal death after BCCAO (A). Rectangles represent the counting areas in the lower magnification, scale bar=500 μm. Cell counting was made at higher magnification, scale bar=50 μm. Fluoro-Jade C and DARPP positive cells were counted (B & C). Values are mean±SD, n=5~6, #p<0.01 vs. WT mice.

