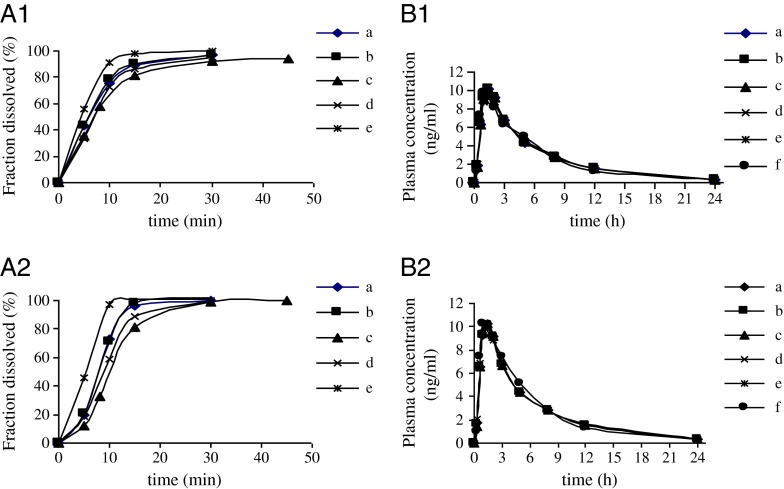
Fig. 4.
The observed and simulated plasma profiles using dissolution data from USP Apparatus 2 in all the dissolution media; reference tablet (A1,B1); test tablet (A2,B2). In phosphate buffer pH 4, 50 rpm (a); in phosphate buffer pH 1.2, 50 rpm (b); in phosphate buffer pH 6.8, 50 rpm (c); in water, 50 rpm (d); in phosphate buffer pH 6.8, 100 rpm (e); observed plasma concentration (f)

