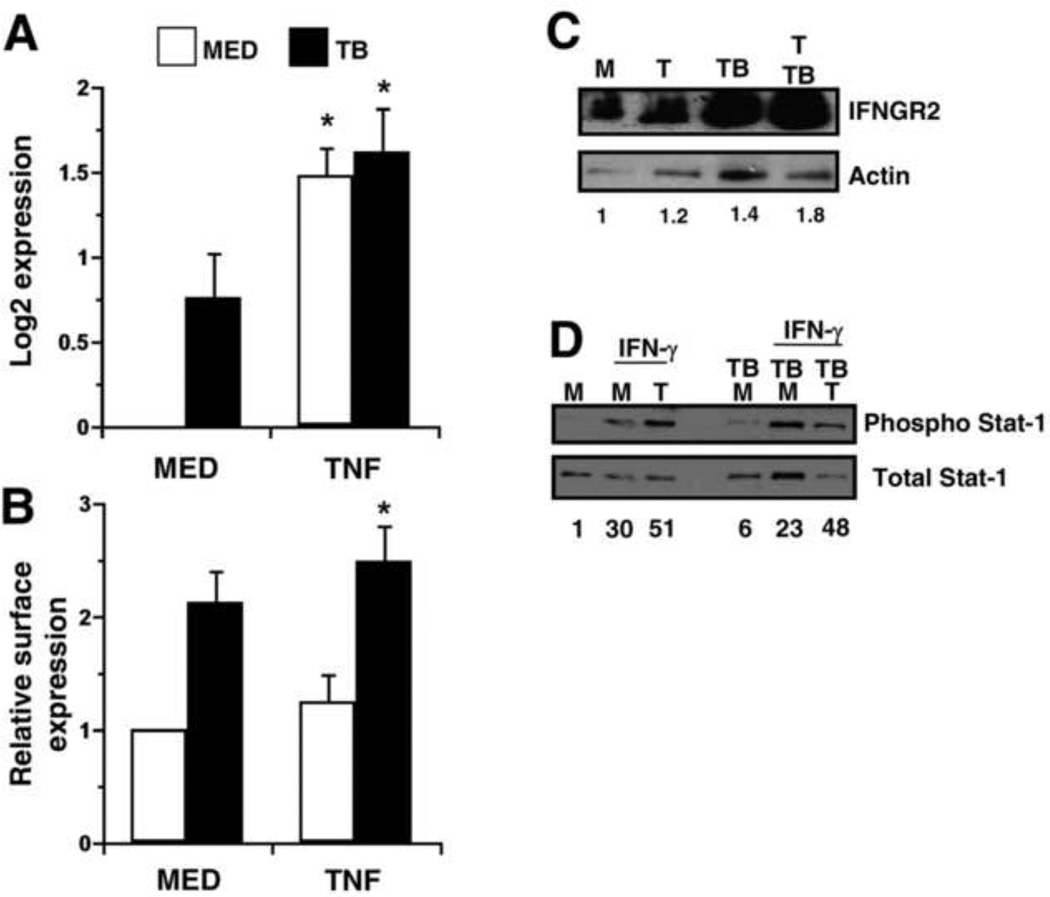
Figure 5.
TNF enhances expression of the IFN-γ-receptor. Macrophages were stimulated with TNF (10 ng/mL) in the presence or absence of MTB. (A) Quantitative analysis of IFNGR2 gene expression at 4 h is presented as the mean log2 change in gene expression of triplicate samples ± SEM for three experiments. Values were normalized to the mean expression of GAPDH within a triplicate sample group and expressed relative to that of medium alone. (B) Macrophages were harvested at 6 h and immunolabeled for surface receptors. The MFI for the cell population corresponding to each treatment condition was normalized to medium alone. The mean data from three separate experiments is shown. (A, B) Asterisks indicate statistical significance in the 95% confidence interval relative to medium alone by two-way ANOVA. (C, D) Macrophages were treated with (T) or without TNF (M) and infected with MTB for 6 h as indicated. (C) Whole-cell lysates were prepared and separated by SDS-PAGE and immunoblotted for IFNGR2 or actin as described in Materials and Methods. The ratio of IFNGR2/actin band intensity was expressed relative to medium alone. An image representative of two experiments is shown. (D) IFN-γ (25ng/mL) was supplied where indicated for an additional hour and whole-cell lysates were prepared. Proteins were separated by SDS-PAGE and immunoblotted for phosphorylated or total Stat-1. The ratio of phospho/total Stat-1 band intensity was expressed relative to medium alone and indicated for each condition. An image representative of three experiments is shown.

