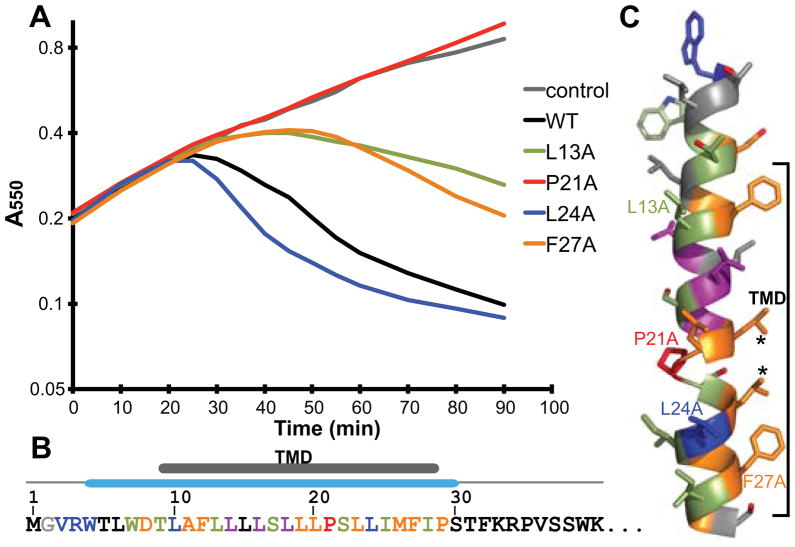
Fig. 2.
Alanine-scanning of the N-terminal domain of E.
A. Representative growth curves of alanine-scanning mutants in Lemo21 cells. Lines are based on the average curve from Fig. S2. Expression of each E construct was induced at time= 0. Various phenotypes and protein expression levels of each mutation are categorized by color: black, no obvious change in lysis onset; blue, faster lysis onset due to higher protein levels; lightgreen, delayed lysis onset due to lower protein levels; purple, colony-to-colony variation in lysis onset; orange, delayed lysis onset with no obvious protein level change; red, no lytic activity with no protein level change.
B. Summary of alanine-scanning results. The first 40 residues of E are shown. The TM domain and the secondary structure are indicated above. Colors of each residue are according to A.
C. A model for the first α-helix. Colors are according to A. Residues from growth curves in A are labeled. Asterisks indicate residues changed to phenylalanine later in the text.

