Fig. 5.
Lysis activity of the minimal region.
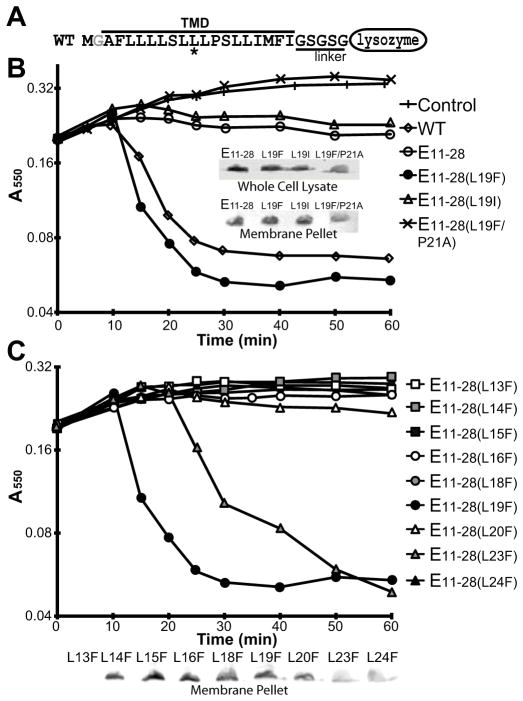
A. Illustration of the minimal region constructs that contains residues 11 to 28 of E followed by the linker and an inactive lysozyme. The asterisk indicates the position of Leu19.
B. Growth curves of wild-type and various minimal region constructs in TOP10 cells. Insert, Western blot of both whole cells and the membrane fraction after 10 min of induction.
C. Growth curves of all Leu-to-Phe mutants of the minimal region in TOP10 cells. Inset, Western blot of the membrane fraction after 10 min of induction. L13F failed to insert into the membrane.

