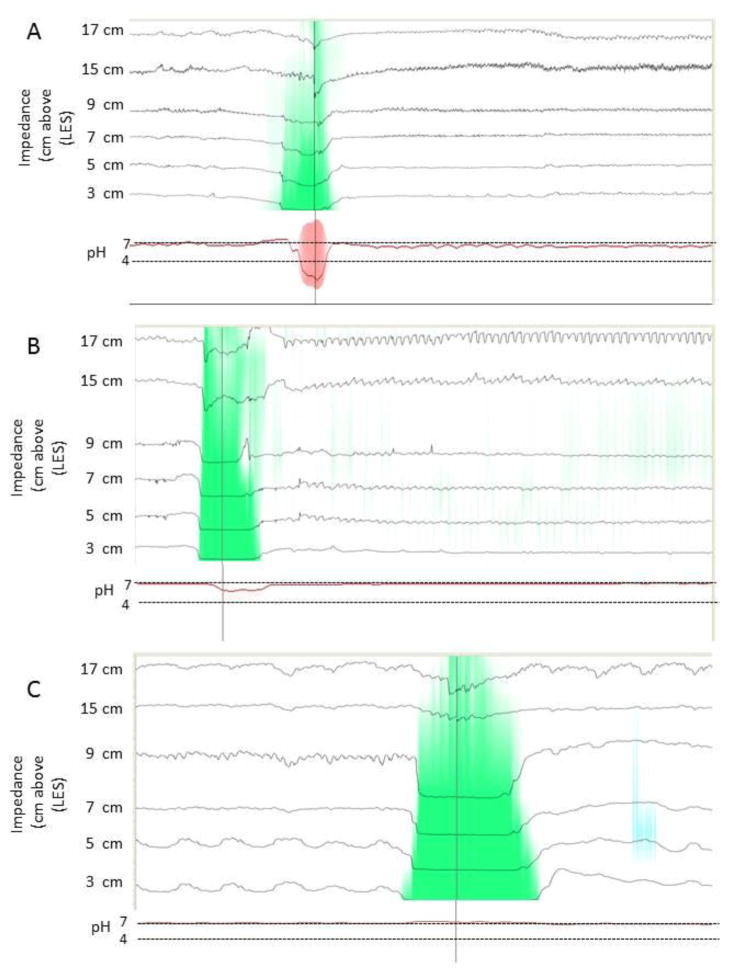
Figure 1.
Impedance-pH recordings demonstrating acid reflux (A), WAR (B), and WAlkR (C). The green colorization on the impedance tracings illustrates the retrograde flow of refluxate to the most proximal recording site (17 cm). The corresponding pH tracing in red at the bottom demonstrates the nadir pH to be 2.3 in A, 5.8 in B, and 7.2 in C.

