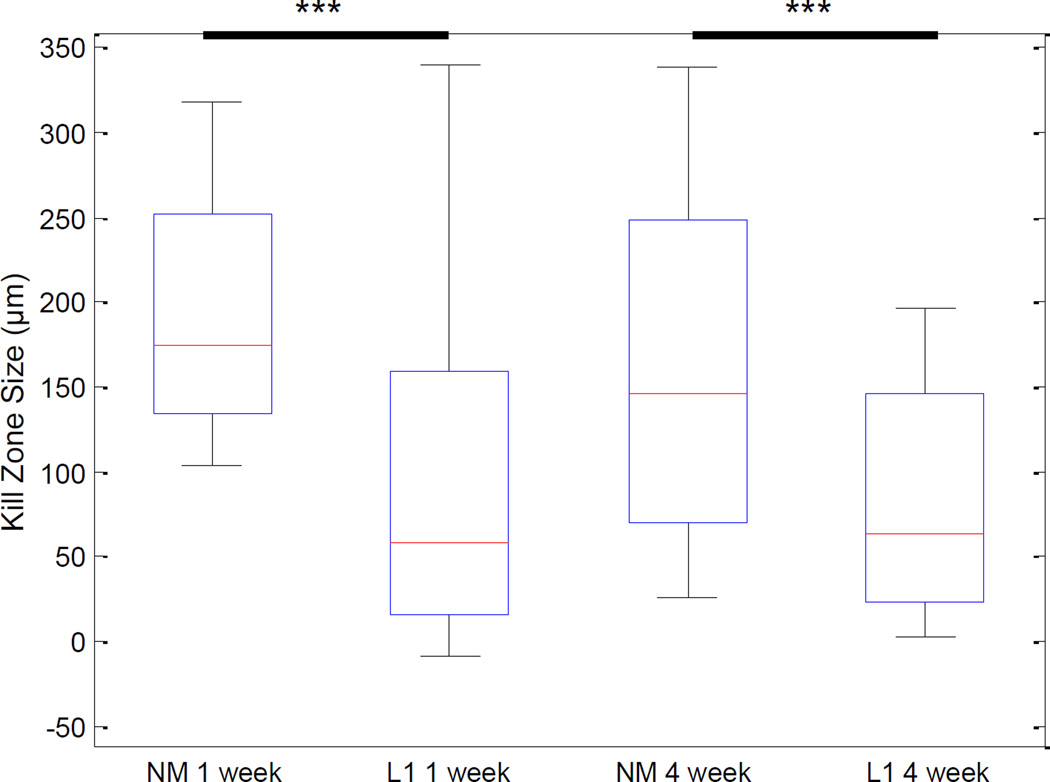
Figure 3.
Quantification of the kill zone size in the spinal cord. DAPI-stained images were used to define the perimeter of each implant and NF200-stained images used to identify the presence of neuronal processes. Kill zone size was computed in 10° bins around the 360° perimeter of the implant site by calculating the distance between the location of NF200 staining and the location of the implant. These distance measures were used to calculate the mean kill zone size and compared via the rank sum test. Significant decreases in kill zone size were observed with the L1 coating at both 1 week and 4 week time points. ***p < 0.001.

