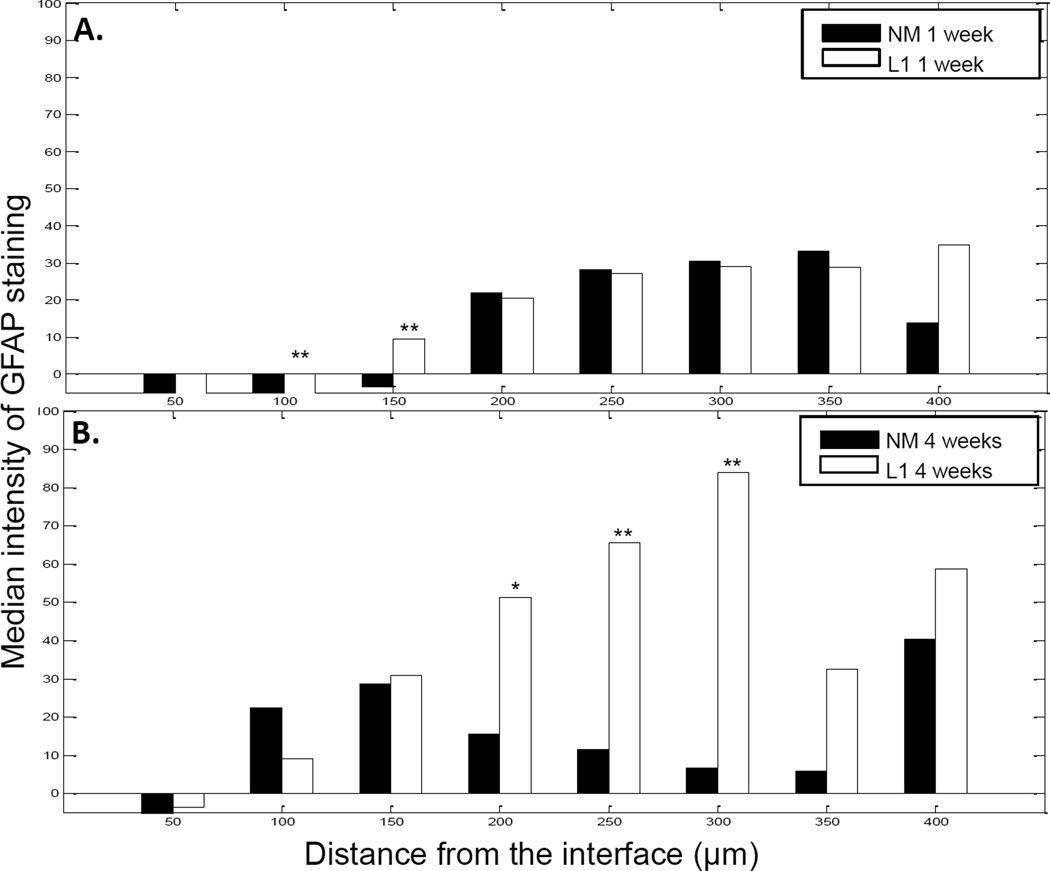
Figure 6.
GFAP staining intensity as a function of distance from the electrode-tissue interface in the spinal cord. MATLAB was used to determine the decline in GFAP staining intensity at 1 week (A) and 4 week (B) time points. The perimeter of the implant site was defined using the DAPI-stained images. Threshold values based on 95% of the background staining for each section were established and GFAP staining above this threshold measured as a function of distance from the implant site. The median intensity values were calculated in 50 µm bins and compared via the rank sum test. A and B: Significant increases were observed with the L1 coating at both 1 week and 4 weeks. *p < 0.05; **p < 0.01.

