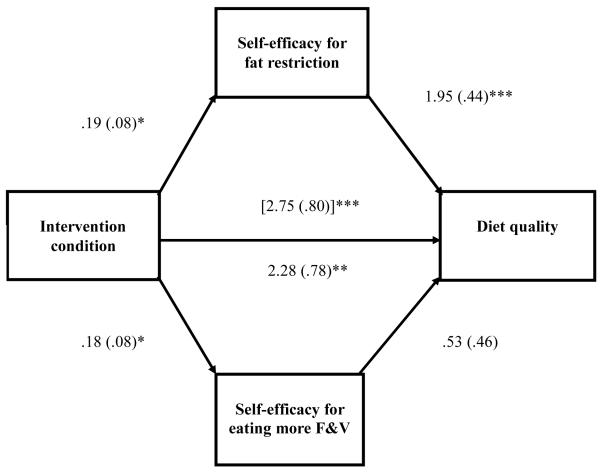
Figure 2.
Model depicting the effects of intervention condition (coded 0 = attention control, 1 = FRESH START intervention) on diet quality at year 2 and mediators at year 1, adjusting for baseline mediator and dependent variables. Unstandardized regression coefficients are reported. Standard errors are in parentheses. The coefficient in brackets is from the model that did not include the mediator. Self-efficacy scores range from 1 to 5 with higher scores indicating greater self-efficacy. Diet quality scores range from 0 to 100 with higher scores indicating better diet quality. F&V = fruits and vegetables. *p < .05. **p < .01. ***p < .001.

