
Figure 7.
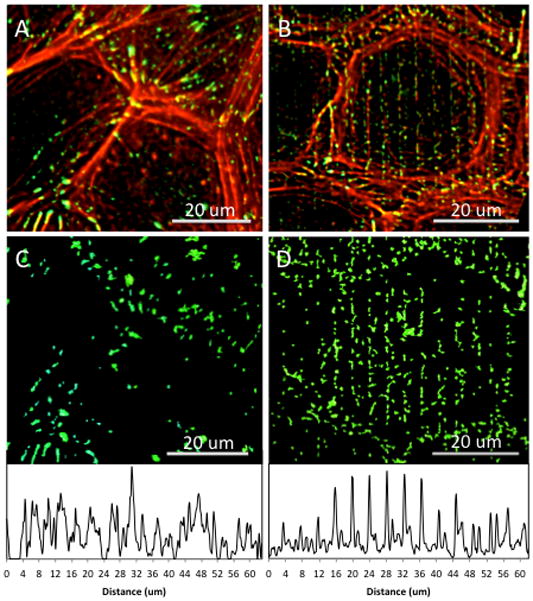
Fluorescent microscopy images of cytoskeletal localization (red – actin, green – vinculin) upon (A) flat and (B) patterned silk film surfaces, with (C–D) respective vinculin localization surface plots shown below to illustrate degree of FA patterning corresponding to signal intensity peaks upon patterned silk topographies as compared to the stochastic peak intensity profiles for flat silk surfaces.