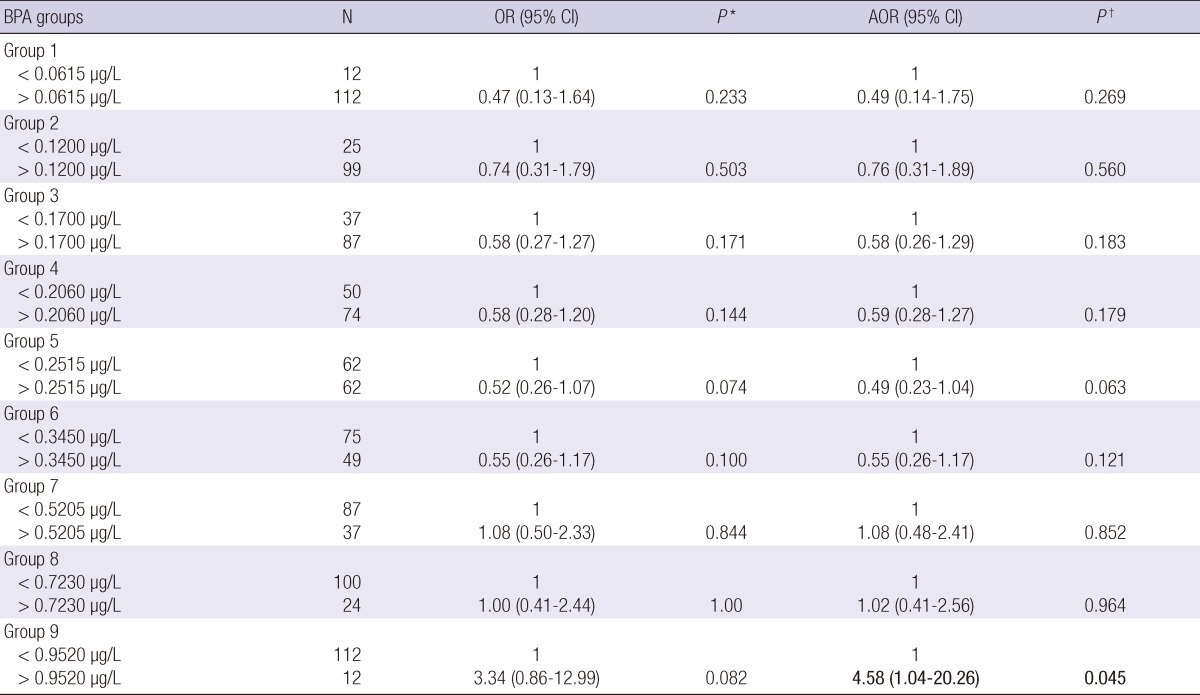
Table 3.
Logistic regression of BPA with the presence of resin filled surfaces according to BPA groups
BPA groups are divided according to 10 percentile of BPA concentration. Bold denotes statistical significance at P < 0.05. *P values obtained from a logistic regression; †P values obtained from a logistic regression adjusted for age, gender, salivary flow rate, salivary buffering capacity, frequency of snacking, and frequency of tooth brushing.

