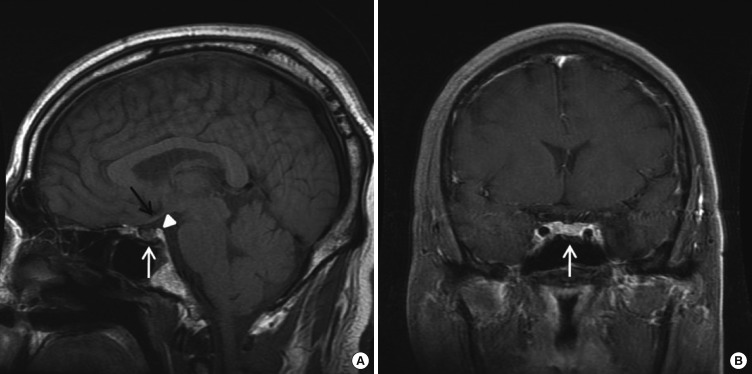
Fig. 3.
T1-weighted magnetic resonance imaging (MRI) at the level of the hypothalamus-pituitary axis. Sagittal (A) and coronal (B) T1-weighted scans show a normal pituitary stalk (black arrow), pituitary gland (white arrow). There was a normal bright spot (arrow head) in the posterior pituitary gland of hyperintense signal in T1-weighted sagittal image (A).

